



Bram Houghton
August 10, 2026
Economy Commentary Monthly update Monthly commentary News


Market Update - August 2026
MARKET UPDATE – July 6th – August 8th 2026
In a Nutshell: Markets recovered strongly this week to begin August as optimism grew of a potential agreement to reopen Hormuz the ships, some reassuring inflation and labour data, and concrete growth and strong earnings to support the recent explosion of AI capital expenditure.
Middle Eastern Conflict
Geopolitical tensions peaked in late July as a breakdown of the June 17th truce triggered renewed strikes and shipping disruptions through the Strait of Hormuz. However, diplomatic efforts saw Oman-mediated talks make significant headway toward a preliminary maritime framework between the U.S. and Iran. This emerging agreement focuses on establishing designated safe commercial transit routes and reopening the vital choke point to stabilize global energy shipping.
Outlook: An Oman-brokered transit agreement may temporarily ease shipping bottlenecks, but underlying political friction will keep security risk premiums embedded in global energy markets.
U.S. Labour Markets
The U.S. labor market displayed structural cooling over the past month in a distinct "low hiring, low firing" environment. Nonfarm payrolls contracted by 23,000 jobs in July, alongside 103,000 in net downward revisions for May and June, leaving the unemployment rate flat at 4.1%. ADP private payrolls added just 44,000 workers, while JOLTS job openings fell by 178,000 to 7.359 million. Layoffs remained constrained at 1.8 million, and weekly initial jobless claims hovered at a muted average of 199,000. Annualized wage growth stabilized at 3.2%, with job-switchers retaining 7.0% gains.
Outlook: Decelerating payroll additions alongside subdued layoffs point to a rebalancing labor market, giving the Federal Reserve flexibility to evaluate monetary policy adjustments.
U.S. Economy
Macroeconomic data reflected moderating real output balanced by sticky core inflation. Q2 real GDP expanded at a +1.5% annualized rate, trailing market expectations of +2.1%. Headline CPI slowed to 3.5% year-over-year in June, while core PCE inflation rose +3.3% year-over-year (+0.1% month-over-month). Business activity provided a positive counterweight, with the S&P Global Flash U.S. Composite PMI climbing to an eight-month high of 53.6 in July, complemented by a +0.3% month-over-month gain in personal spending.
Outlook: Slower GDP growth paired with stable service-sector output supports a cautious, data-dependent approach from the Federal Reserve.
Canadian Economy
Canada’s economy showed resilient domestic demand alongside easing price pressures. Q2 GDP growth accelerated to an estimated 2.5% annualized rate, bouncing back from flat early-year output. Headline inflation dropped to 2.8% in June, driven by a 10% month-over-month decline in gasoline prices, which pulled preferred core inflation metrics below the 2.0% target. Industrial activity improved as the S&P Global Manufacturing PMI rose to 53.5 in July, while May retail sales increased 1.0% to $73.7 billion.
Outlook: With core inflation anchored below target and consumer spending rebounding, the Bank of Canada is positioned to keep interest rates steady to nourish third-quarter momentum.
Eurozone and UK Economy
European economic activity expanded moderately through July, driven by services, though inflation trends diverged.
Second-quarter Eurozone GDP grew by +0.4% quarter-over-quarter (+1.0% YoY), while the July Composite PMI reached an eight-month high of 52.0. German CPI edged up to +2.8% YoY, while Eurozone unemployment held at 6.3%.
The UK Composite PMI rose to 52.1 in July on expanding services, though headline UK CPI unexpectedly ticked up to 2.7% YoY.
Outlook: Expanding service activity alongside persistent headline inflation constrains both the European Central Bank and the Bank of England from aggressive near-term rate cuts.
Asia and Far East
Asian economic conditions split between domestic real estate headwinds in China and industrial expansion in Japan.
Growth slowed in China as Q2 GDP reached 4.3% YoY, underperforming official targets. Official state data saw the NBS Manufacturing PMI contract to 49.2 in July, while the private Caixin PMI held in expansion at 50.8, with CPI muted at 0.9% YoY.
Japan’s Headline CPI reached 1.7% YoY in June (Tokyo Core at 1.9% in July). Industrial momentum picked up sharply, boosting the S&P Global Japan Composite PMI to 53.1 in July.
Outlook: China will require targeted central fiscal stimulus to counter persistent property weakness, whereas Japan’s steady wage-price dynamics keep the Bank of Japan on track for gradual policy normalization.
Commodities
Energy markets reacted to late-July Strait of Hormuz negotiations against a backdrop of rising U.S. domestic inventories. EIA data revealed an unexpected 2.5 million barrel build in U.S. crude stockpiles (to 407M) and a 33 Bcf build in natural gas storage, both exceeding market expectations. Despite growing supply reserves, crude oil traded near $77 per barrel due to lingering transit risks, while spot gold surged to record highs between $4,100 and $4,243 / oz on safe-haven demand.
Outlook: Expanding domestic oil and gas reserves create near-term price caps, though geopolitical risk premiums will keep gold anchored near historical highs.
Latest Equity Market Data
| Market Data | S&P/TSX | S&P 500 | DOW | NASDAQ | STOXX EU | WTI | GOLD |
| This Week | 2.5% | 2.1% | 1.6% | 3.0% | 1.5% | -9.0% | 8.7% |
| Last Month | 3.1% | 3.4% | 2.1% | 3.4% | 3.2% | 9.4% | 6.2% |
Reuters Market Updates http://www.reuters.com
Bloomberg Market Updates - https://www.bnnbloomberg.ca/markets
Sometimes Good Isn’t Good Enough by Craig Basinger & Derek Benedet at Purpose Investments Link to article
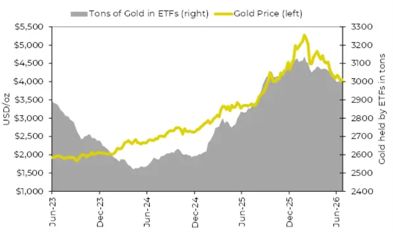
Following a sensational rally, gold and mining equities underwent a sharp digestion phase dropping roughly 25% and 33% respectively. This was driven by rising real yields and a firm U.S. dollar rather than broken fundamentals. However, institutional demand rebounded strongly in Q2 with record net purchases of 289 tonnes led by China. With bullion carving out a firm technical bottom near $4,000/oz, ETF outflows stabilizing, and gold producers continuing to generate strong free cash flow and growing dividends, Gold should begin to trade on fundamentals again and offer the portfolio diversification and inflation protection that it has in previous years.
Investor selling of Gold has slowed
Source: Bloomberg, Purpose Investments
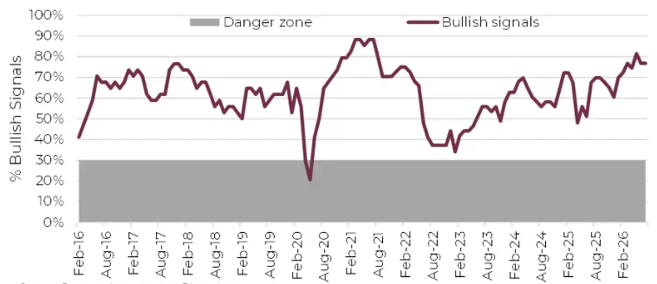
Across broader capital markets, economic foundations remain resilient despite heightened AI-driven volatility. While strong GDP figures and healthy earnings data continue to support equities, underlying consumer metrics show subtle signs of friction, including softening Q3 credit card spending and tightening bank lending standards. While market cycle indicators do not point to an immediate downturn, elevated valuations and late-cycle dynamics justify maintaining a slightly defensive stance.
Market Cycle Indicators – Very Healthy
Source: Bloomberg, Purpose Investments
Outlook: Looking ahead, gold appears well-positioned for a second-half rebound, backed by persistent central bank buying and strong support around $4,000/oz. In broader equities, solid fundamental data should prevent severe downside, but rich valuations and softening consumer spending metrics suggest upside may be constrained—favoring a defensive portfolio posture that prioritizes cash-flow-generating producers and structural hedges.
MacroMemo - July 21 - August 10, 2026 by E.Lascelles, J.Nye Link to Article
Falling AI Token Prices
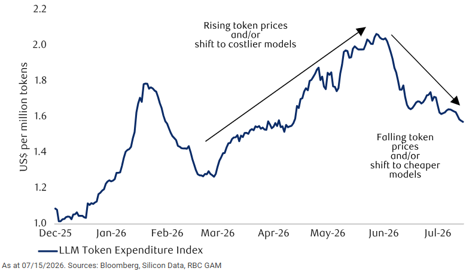
Driven by the high token consumption of agentic AI models, enterprises are enforcing tighter budget caps and shifting non-critical workloads to open-weight alternatives. At the same time, sharp declines in per-token production costs are triggering Jevons paradox where lower unit prices fuel exponential growth in total AI adoption and usage across the market.
Outlook: As enterprise buyers become more cost-disciplined, demand will increasingly split: routine tasks will move toward lower-cost open-weight models, while premium frontier models will be reserved for complex, high-value tasks. While overall token volume will continue to surge, proprietary model developers face tighter margins and lower enterprise stickiness if switching costs remain low.
Weighted average token prices are down more than 20% from recent highs
U.S. midterms preview
Current projections point toward a split Congress following the U.S. midterm elections, with Democrats expected to capture the House while Republicans retain control of the Senate. Overall market impact is expected to be minimal, as this outcome is largely priced in and major macro forces such as AI spending, geopolitical developments, and monetary policy continue to dominate investor focus.
Democratic Party poised to take control of the House
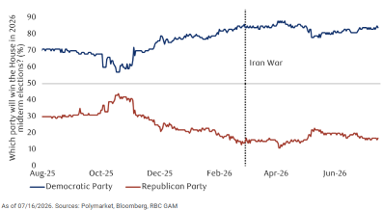
Republicans continue to lead in Senate race despite ongoing Iran War
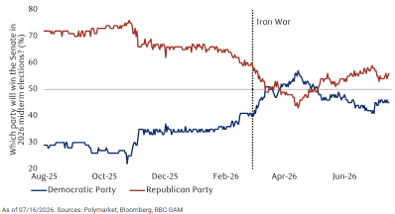
Outlook: At the margin, this split-government scenario tilts the balance of risk toward slightly softer equities, modestly lower bond yields, and a marginally weaker U.S. dollar, though any shifts are likely to remain subtle.
Canada's Economy Shows Resilience as Q2 Growth Outpaces Forecasts by AdvisorAnalyst Link to Article
Canada’s economy delivered a strong rebound in the second quarter, expanding 0.3% in May with preliminary estimates pointing to another 0.2% gain in June. This puts Q2 annualized growth on track for 3.4%, significantly beating forecasts of 2.2% and confirms a solid recovery following a flat winter period. Growth was notably broad-based across goods and services, propelled by gains in manufacturing, energy, construction, and a fourth straight monthly increase in real estate activity signaling "green shoots" in housing. While trade-sensitive sectors like wholesale continue to feel the pressure of U.S. tariff announcements, the broader economic foundation shows robust underlying momentum.
Canada’s monthly GDP by Industry
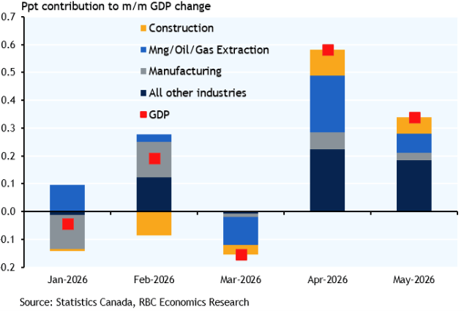
Economic Outlook: Looking ahead to the second half of the year, strong Q2 momentum and stabilizing labor markets provide a solid buffer, though trade policy uncertainty and U.S. tariffs remain key downside risks. Investors should anticipate a more tempered growth environment in H2, with near-term rate and currency expectations shifting to reflect stronger domestic resilience alongside ongoing global trade headwinds.
Build a Better Path Part One: What’s Past Is Prologue by Richard A. Brink, CFA, AllianceBernstein Link to Article
With expectations for more moderate market returns and less guaranteed policy support during financial crises, retirees face a shrinking margin of safety. This dynamic is particularly hazardous when paired with ongoing income withdrawals, where an ill-timed downturn near or during retirement can permanently impair a portfolio's longevity. To protect long-term financial security, modern portfolio design must move beyond chasing raw benchmark returns and focus explicitly on mitigating drawdowns.
Up/Down Capture Strategies Have Been Effective
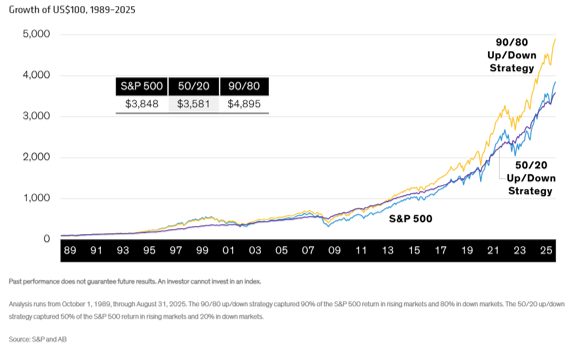
A key strategy for strengthening portfolio resilience lies in optimizing up/down capture—participating meaningfully in market rallies while sacrificing a small degree of upside to cushion against declines. Over extended horizons, limiting downside capture, with a common goal for a portfolio manager being 90% upside capture and 80% downside capture, can actually yield higher cumulative wealth than the broader market while delivering a far smoother return path. By prioritizing downside protection, portfolios can effectively safeguard capital during periods of market stress without sacrificing the long-term growth needed to sustain retirement.
Looking ahead, as lower baseline returns and heightened volatility test traditional allocation models, portfolio construction will increasingly favor asymmetric return profiles. Advisors and investors preparing for or in retirement should pivot toward strategies designed to improve the path of returns using superior up/down capture to smooth portfolio volatility, buffer against distribution-phase drawdowns, and maintain long-term capital preservation.
Related posts
Bram Houghton
October 13, 2026
Market Update - October 2026
Highlighting the key aspects of what we have seen in global markets and the economy over the last two weeks.
Read moreBram Houghton
July 06, 2026
Market Update - July 2026
Highlighting the key aspects of what we have seen in global markets and the economy over the last two weeks.
Read more