


How Magnificent are the Mag 7
Markets to November 30, 2025
Markets continued to grind higher into the end of November. Historically, November and December tend to be the strongest months of the year where performance is concerned but with September and October performing exceptionally well in 2025, two months where we normally see weakness, that may have pulled performance forward so investors waiting for a Santa Claus rally and strong November and December may be disappointed. This just goes to reinforce the adage that the markets always tries to reward the fewest.
S&P/TSX Composite -Total Return index gained 3.9% in the month of November and is up 30% year to date. S&P 500 Index – Total Return index squeezed out a 0.2% gain for November and is up 17.8% year to date. Int’l Markets as measured by the MSCI EAFE – Total Return gained 0.6% during November, and is up 28% year to date. Bonds, as measured by the FTSE Canada Bond Universe Index returned 0.3% for the month of November and is up 4% year to date.
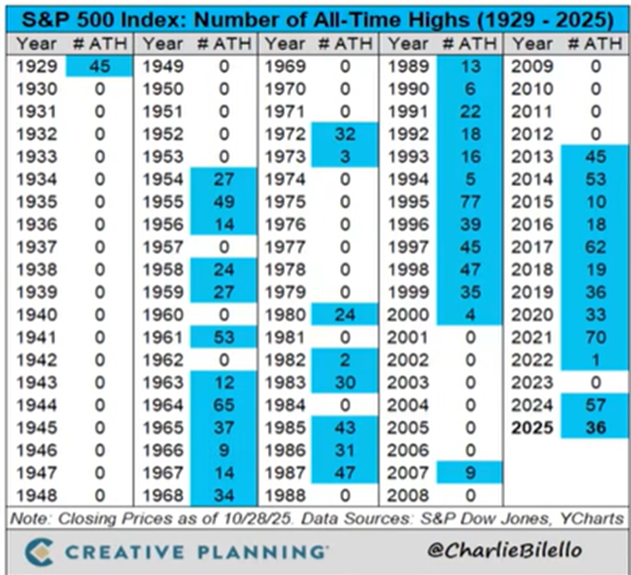
investors thought 2025 would be more subdued, following the 57 all-time closing highs reached on the S&P 500 Index over the course of 2024. At first it seemed this outlook would be proven correct as the S&P500 Index decline 20% into April of 2025, thanks to President Trump’s tariffs, but here we are at 36 new all-time highs half way through the month of December. Those who thought the party couldn’t continue and moved to cash or took a defensive position, are now looking to course correct. This is why it is better to have a solid investment plan in place, otherwise it is easy to get whipsawed around with changing market dynamics.
It seems to whole world was waiting with bated breath for Nvidia to announce its earnings on November 19, 2025. The concern was, should Nvidia disappoint, that may reinforce the belief that we are in an IA bubble that is destined to burst. Well, Nvidia reported stellar earnings and a rosy outlook, and while the stock initially rallied, praised quickly turned to scorn with Nvidia finishing down.
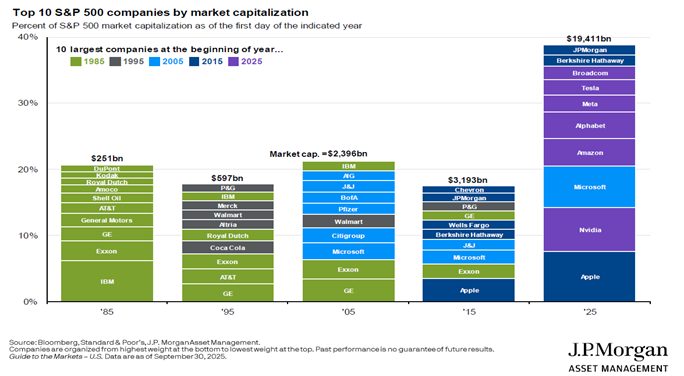
so much talk of the Magnificent 7, I thought it might may worthwhile to take a closer look at them. Most will already know that the Mag 7 make up a large part of the S&P 500 Index , but as the chart below shows the largest 10 companies going back to 1985, 2025 really stands out. If we take JP Morgan, Berkshire Hathaway and Broadcom out of the 10, the remaining 7 still eclipses the value of the top 10 stocks in each prior 10 year period; and not by a small margin.
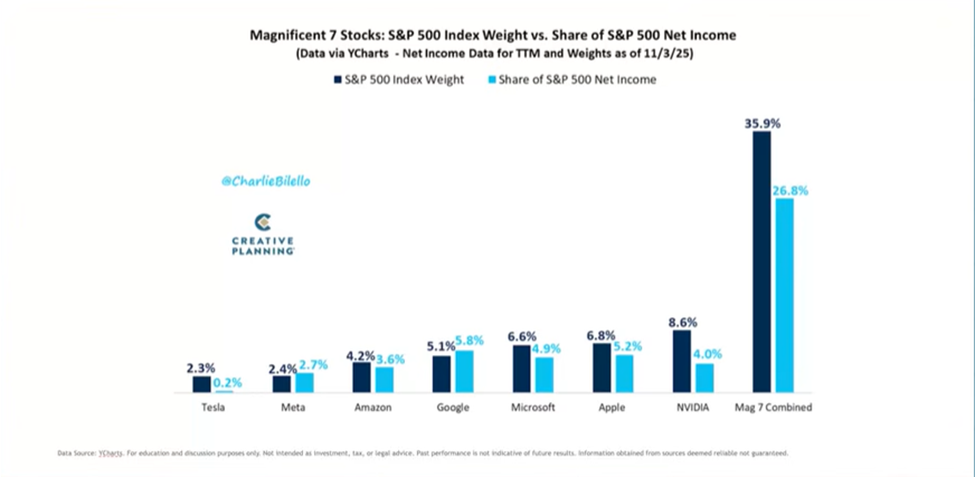
The following chart shows the contribution of the Mag 7 to the S&P 500 Index. Combined, they make up roughly 36% of the index as measured by market capitalization and the combined net earnings of these 7 companies accounts for 26.8% of the index. While the Mag7 companies dominate in terms of Market Capitalization and net income, they do so because these seven companies generate more revenue than the bottom 250 companies in the S&P 500. The 26.8% combined earnings of the Mag7 is also greater than the bottom 250 companies in the S&P 500. While we do not aim to blindly own the Mag7 companies in our portfolios, we do recognize their importance in portfolios. It should be noted that for 2025, not all companies in the Mag7 were able to beat the index. Only Google and Nvidia were able to beat the indices return of 18.0%, with Amazon returning 4.6% as of December 5, 2025. There are many stocks in the S&P 500 Index which rewarded investors with stellar returns, outpacing the index and most the Mag7 stocks; an investor just had to be willing to do the work to identify such stocks.
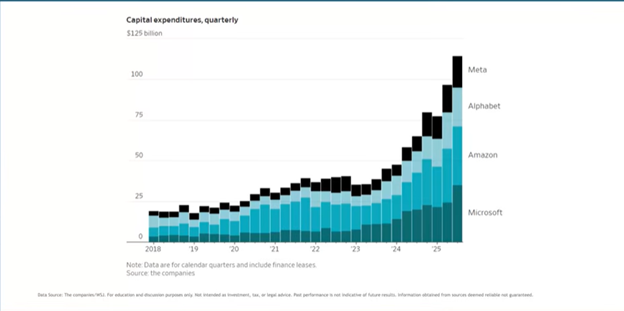
With such a large share of the revenue and net income of the companies that comprise the S&P500, it also makes sense that the Mag7 also accounts for a large portion of expected capital expenditures, currently driven by investments in AI. As companies continue to direct massive amounts of their budget to AI projects, some investors are getting concerned that these large expenditures may not produce the stellar profits so many are expecting, reminiscent of the expenditures seen in 1999 that resulted in so many failed companies,
State of the Markets
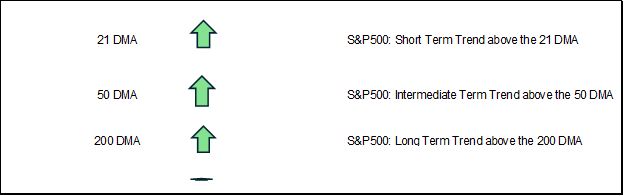
The above indicators are used to assess current trends in the S&P500. The current picture suggests that all is not a grim as we may feel. Market technicals suggest the markets are fine, currently sitting above key moving average levels, namely the 21 day, 50 day and 200 day moving averages. The market doesn’t really get into trouble until we breach the 200 day moving average.
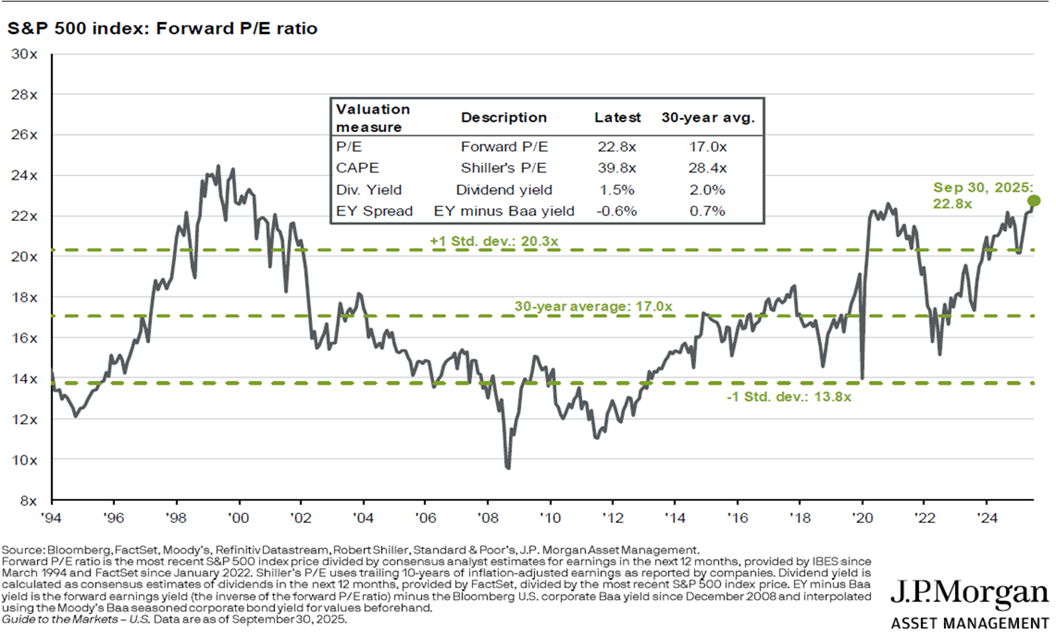
Investors have maintained a cautious, defensive stance within their portfolios, due to the fact that equities remain at elevated valuation levels as indicated in the chart below. This concern is not without merit as elevated valuation levels often leads to lower future returns in stocks. Currently, we are not too far off extreme valuation levels seen at previous market tops.
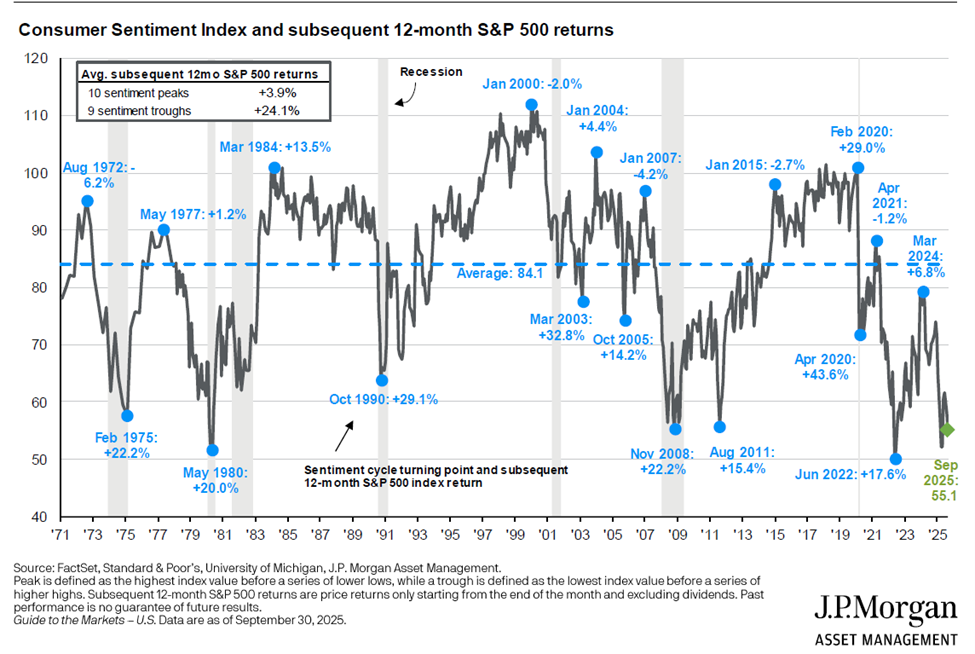
The final chart we’ll look at is from JP Morgan and measures investor sentiment. This chart shows that investor sentiment is relatively low, which tends to result in better than expected future returns. So while pullbacks will happen and should be expected, the current set up in the markets may prove to be a buying opportunity. For now, we remain long, but are continuously assessing the market action for signs of changing risk factors within the market, within our holdings, and ready to make adjustments as needed.
Final Thoughts
I suspect markets will continue to be volatile going into 2026. While fiscal and monetary policies being pursued in the US should be favorable to markets, concerns about valuations will likely continue to hold back animal spirits. That being said, with spending from the Big Beautiful Bill and a new Federal Reserve Chairman who will likely align with President Trump’s desire for lower rates, that could provide a tailwind for investors. With the mid-terms in late 2026, the Republicans will do everything within their power to make sure the economy doesn’t faulter and that voters are happy, are at least appeased. Should peace reign, and certainty in geopolitics preside, that may be enough to see the markets continue to climb this wall of worry.
In this environment, maintaining a disciplined approach and making informed, strategic adjustments will be essential. Investors who remain focused on their long-term goals—and actively explore all available tools—will be best positioned to navigate the evolving market landscape.
If you have any questions or would like to explore investment strategies tailored to your goals, you can reach me at Winston.mundy@cibc.com or 905-462-1547.
Warm regards
This information, including any opinion, is based on various sources believed to be reliable, but its accuracy cannot be guaranteed and is subject to change. CIBC and CIBC World Markets Inc., their affiliates, directors, officers and employees may buy, sell, or hold a position in securities of a company mentioned herein, its affiliates or subsidiaries, and may also perform financial advisory services, investment banking or other services for, or have lending or other credit relationships with the same. CIBC World Markets Inc. and its representatives may receive sales commissions and/or a spread between bid and ask prices if you purchase, sell or hold the securities referred to above. © CIBC World Markets Inc. 2025.
CIBC Private Wealth consists of services provided by CIBC and certain of its subsidiaries, including CIBC Wood Gundy, a division of CIBC World Markets Inc. The CIBC logo and “CIBC Private Wealth” are trademarks of CIBC, used under license. “Wood Gundy” is a registered trademark of CIBC World Markets Inc.
The enclosed research report(s) from FINRA dealers or other CIRO-recognized foreign regulators are not prepared subject to Canadian disclosure requirements under CIRO Rules.