



July 28, 2026



Do You Really Need to Time the Market?
Wood gundy
WHITE PAPER - THE EVIDENCE SERIES
Do You Really Need to Time the Market?
Why Staying Invested Is the Strategy
Ilan Zor | Wealth Advisor, CIBC Wood Gundy | July, 2026
Executive Summary
Every time markets drop, the same instinct kicks in: get out, wait for things to settle, and re-enter when it feels safer. It feels prudent. The data says otherwise. The evidence accumulated over nine decades of market history tells a consistent and clear story, one that most investors never see because it rarely makes headlines.
This paper draws on 2 sources: CIBC Asset Management’s 2026 The Big Picture chart, which tracks asset class performance since 1935, and the CIBC Volatility and Return analysis, covering 1,081 rolling one-year periods from January 1935 through December 2025. The data consistently shows that time in the market, combined with a properly structured and diversified portfolio, is a more reliable path to long-term wealth preservation and growth than attempts to time entry and exit points.
The cost of being wrong about timing is not symmetric. Missing the best trading days of a decade can permanently impair a portfolio in ways that avoiding the worst days cannot fully offset.
1. The Long-Term Record of Asset Classes
The most striking feature of long-term market data is not volatility. Rather, it is the compounding effect of staying invested. The table below summarizes the growth of $1,000 invested across major asset classes from 1935 through 2025, alongside annualized returns and the frequency of negative one-year rolling periods.
| Asset Class | $1,000 Grew To (1935–2025) | Annualized Return | 1-Year Negative Frequency |
| U.S. Stocks | $24,806,329 | 11.8% | 21.0% |
| Canadian Stocks | $5,330,048 | 9.9% | 25.6% |
| Balanced Portfolio | $2,356,326 | 8.9% | 16.1% |
| International Stocks | $1,498,532 | 8.4% | 30.5% |
| Bonds | $143,922 | 5.6% | — |
|
| $41,961 | 4.2% | — |
| Inflation | $22,831 | 3.5% | — |

Source: CIBC Asset Management, The Big Picture 2026. Growth of $1,000 since 1935.
Several observations are worth noting. First, equities have substantially outpaced both bonds and inflation over the full period. A balanced portfolio combining equities, fixed income, and diversification across geographies, generated $2.36 million from a $1,000 starting point while experiencing meaningfully lower volatility than pure equity exposure.
Second, the frequency of negative one-year periods is not trivial. Canadian stocks produced a negative return in approximately one in four calendar years. International stocks fared worse, posting losses 30.5% of the time. Yet despite this short-term variability, the long-term compounding effect remained strongly positive across every asset class.
Third, inflation often overlooked as a benchmark, grew $1,000 to only $22,831 over the same period. The real cost of holding cash, or near-cash instruments, is not nominal; it is the permanent erosion of purchasing power relative to invested capital.
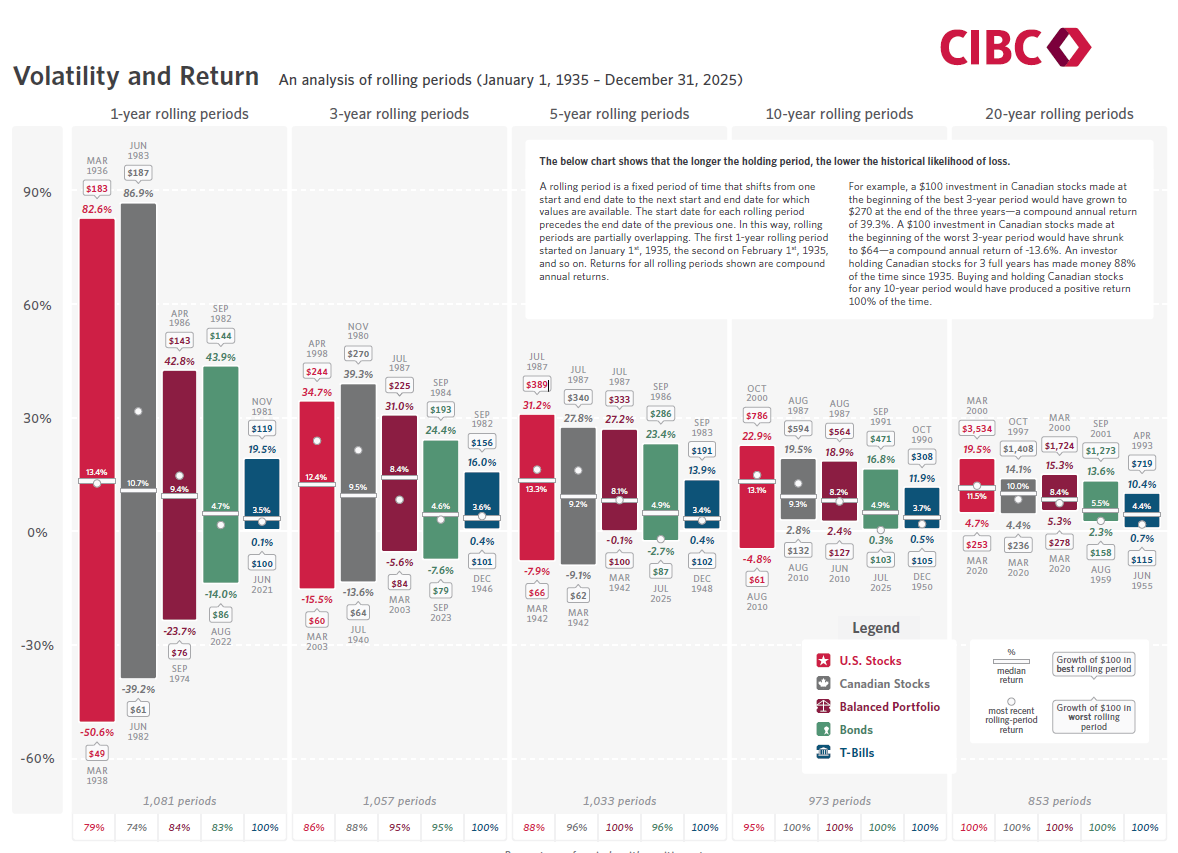
FIGURE 1: CIBC Asset Management - The Big Picture 2026. Growth of $1,000 across asset classes, 1934–2025.
2. Time in the Market: What the Data Actually Shows
One of the most consequential and least understood aspects of equity investing is the relationship between holding period and the probability of a positive outcome. Short-term market returns are highly variable and largely unpredictable. The longer the holding period however, the more the data shifts from uncertain to decisive.
The CIBC Volatility and Return analysis tracks rolling period returns across 1,081 one-year periods through 853 twenty-year periods. The table below shows the percentage of periods in which each major asset class produced a positive return, alongside the median annual return for Canadian stocks.
| Holding Period | Cdn Stocks | U.S. Stocks | Bal. Portfolio | Bonds | Median Return (Cdn) |
| 1 year | 74% | 79% | 84% | 83% | 10.7% |
| 3 years | 88% | 86% | 95% | 95% | 9.5% |
| 5 years | 96% | 88% | 100% | 96% | 9.2% |
| 10 years | 100% | 95% | 100% | 100% | 9.3% |
| 20 years | 100% | 100% | 100% | 100% | 10.0% |
Source: CIBC Asset Management, Volatility and Return: An Analysis of Rolling Periods, January 1, 1935 – December 31, 2025.
The data is unambiguous. Over a one-year horizon, Canadian equities produced a negative return roughly one quarter of the time. Extend the holding period to ten years, and Canadian stocks, balanced portfolio, and Bonds all produced a positive return 100% of the time, across 973 observed periods spanning nine decades, including the Great Depression, World War II, the stagflation of the 1970s, the Dot Com collapse, the 2008 financial crisis, and COVID-19. Extend it to twenty years, and that result holds across every asset class in the dataset. Not most of the time, every time.
These are not theoretical projections. They are observed outcomes across every window available in the data. Market timing asks an investor to successfully predict both when to exit and when to re-enter. The historical record shows that the cost of getting either decision wrong, and missing even a fraction of the compounding that accumulates over a decade, is one of the most consequential financial mistakes available to a long-term investor.
An investor who held Canadian stocks for any 10-year period since 1935 made money every single time. The data does not support the case for timing the market - it supports the case for staying in it.
3. The Behavioural Cost of Market Timing
The academic and empirical literature on investor behaviour consistently documents a gap between market returns and investor returns, a gap attributable primarily to the timing of entry and exit decisions. Investors tend to increase equity exposure following strong performance and reduce it following losses, which is the inverse of the buy-low, sell-high logic that motivates timing behaviour in the first place.
This pattern is not a reflection of irrationality. It reflects the asymmetric emotional weight of losses relative to gains, a well-documented feature of human decision-making under uncertainty. The problem is not that investors make poor decisions; it is that the decisions that feel most prudent in a volatile market environment are often the ones that cause the most long-term damage.
A portfolio that an investor can hold through a 30% drawdown, because it is appropriately sized to their risk tolerance, time horizon, and income needs, will almost always outperform a more aggressive portfolio that the investor exits at the worst possible moment. Vanguard’s Advisor’s Alpha research quantifies this: behavioural coaching, keeping investors from making reactive decisions at the wrong moments, is worth approximately 150 basis points per year in added net returns. That is not a rounding error. On a $500,000 portfolio over ten years, it is the difference between a good outcome and a significantly better one.
The most important variable in long-term investment outcomes is not portfolio construction, it is investor behaviour. A portfolio held through volatility outperforms a superior portfolio abandoned during it.
4. What the Evidence Supports
Time horizon is the most powerful determinant of equity risk. The risk of a permanent loss from equity exposure declines substantially as the holding period extends. For investors with a ten-year or longer horizon, the historical evidence suggests that market timing as a risk management strategy is largely unnecessary and frequently counterproductive.
Diversification across asset classes, geographies, and strategies materially reduces drawdown severity without proportionally reducing long-term returns. The comparison of concentrated equity exposure to a balanced portfolio across every major market dislocation in the dataset makes this case clearly.
The real risk for most investors is not volatility. It is the combination of insufficient time in the market and behavioural responses to short-term price movements that convert temporary losses into permanent ones. A plan that accounts for an investor’s actual time horizon, income requirements, and risk tolerance is the most reliable framework available.
The question is not whether now is a good time to invest. It rarely is or is not in isolation. The question is whether the portfolio is right for the investor’s life, and whether they can hold it through the inevitable periods when it will not feel good to do so.
A Conversation Worth Having
The evidence in this paper does not suggest that all portfolios are appropriate for all investors at all times. Asset allocation, risk tolerance, time horizon, income needs, and tax considerations are all legitimate variables that should inform portfolio structure.
What the evidence does suggest is that the instinct to wait for a correction, for a clearer picture, for a more comfortable entry point, has historically been one of the more expensive decisions available to long-term investors. The cost of that wait is not always visible in the short term. Over a decade or more, it compounds.
If you are approaching retirement, navigating a life transition, or simply have not reviewed your portfolio against your actual goals and timeline in a while, that conversation is worth having sooner rather than later. The evidence in this paper is not an argument for any particular investment. It is an argument for the right structure, the right time horizon, and someone who will help you hold to it when it is hardest to do so.
Ilan Zor | Wealth Advisor, CIBC Wood Gundy
416.861.8751 ilan.zor@cibc.com
Data references CIBC Asset Management’s “The Big Picture” 2026 (asset class returns since 1934) and the CIBC Volatility and Return analysis (January 1, 1935 – December 31, 2025). Past performance is not indicative of future results. This commentary is for informational purposes only and does not constitute investment advice.
CIBC Private Wealth consists of services provided by CIBC and certain of its subsidiaries, including CIBC Wood Gundy, a division of CIBC World Markets Inc. The CIBC logo and “CIBC Private Wealth” are trademarks of CIBC, used under license. “Wood Gundy” is a registered trademark of CIBC World Markets Inc.
This information is based on various sources believed to be reliable, but its accuracy cannot be guaranteed and is subject to change. Clients are advised to seek advice regarding their particular circumstances from their personal tax and legal advisors. If you are currently a CIBC Wood Gundy client, please contact your Investment Advisor.
Related posts
Ilan Zor
September 04, 2026
The Cost You Don't See
CIBC Wood Gundy white paper by Ilan Zor on the hidden costs of DIY investing, including behavioural mistakes, structural inefficiencies, and the time and attention required to manage a portfolio alone...
Read moreIlan Zor
May 19, 2026
The Retirement Urgency Gap
Many successful, busy individuals approach retirement with hope rather than a concrete plan, often assuming that doing “fine” today will translate into security tomorrow.
Read more