September 20, 2023
Money Financial literacy Economy Good reads Commentary Quarterly update Quarterly commentary Monthly update Monthly commentary In the news News TrendingSeptember 2023 Market Commentary
September Market Update 2023
September is here, the kids are back in school, and the markets turn their attention to the push to year end and beyond. This is often the time of year when companies come clean about their ability to meet their earnings estimates for the year, and offer up their guidance for the remainder of the year. If there is going to be disappointing results, now is often when you hear about it. This is why August and September are often the worst performing months of the year, with more volatility than any other month.
This year has been no exception. After a strong runup in technology stocks to the end of July, these high flyers began to roll over in August. The tech heavy Nasdaq index dropped 7% in the first three weeks of the month before regaining half of this by early September. The reason for this drop wasn’t that investors had lost faith in the future growth opportunities in the sector, but rather because they had run too far too fast and were due for a pull back.
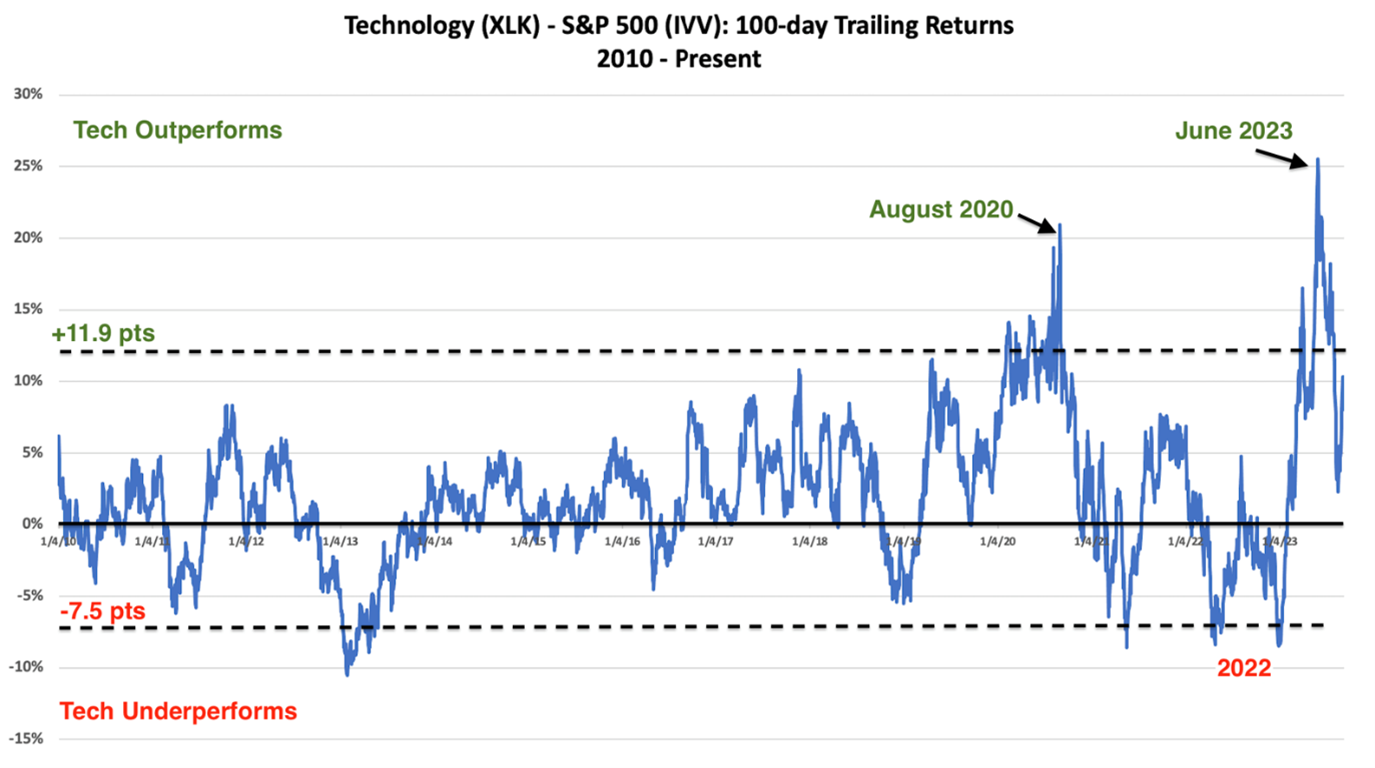
The chart above shows the 100 day trailing returns of technology stocks vs their long term averages, spiking two standard deviations above the mean. The recent pullback now gives investors wanting to add to this sector a viable entry point. We continue to view US large cap technology stocks as a key driver of stock market returns going into 2024. In fact, the Nasdaq index would have to rise another 16% from current levels to reach it’s prior all-time highs of 2021, and many individual names of still down 30% from their prior highs.
In the last month we have also seen money moving into some of the over-sold value sectors with the rotation out of growth. In particular, energy stocks have done well, the catalyst being the new 1 million barrel per day reduction of oil output from Saudi Arabia and Russia, now extended to year end. This sector is notoriously volatile and investors are wise to limit their enthusiasm, as the trend could reverse once the over-sold conditions abate.
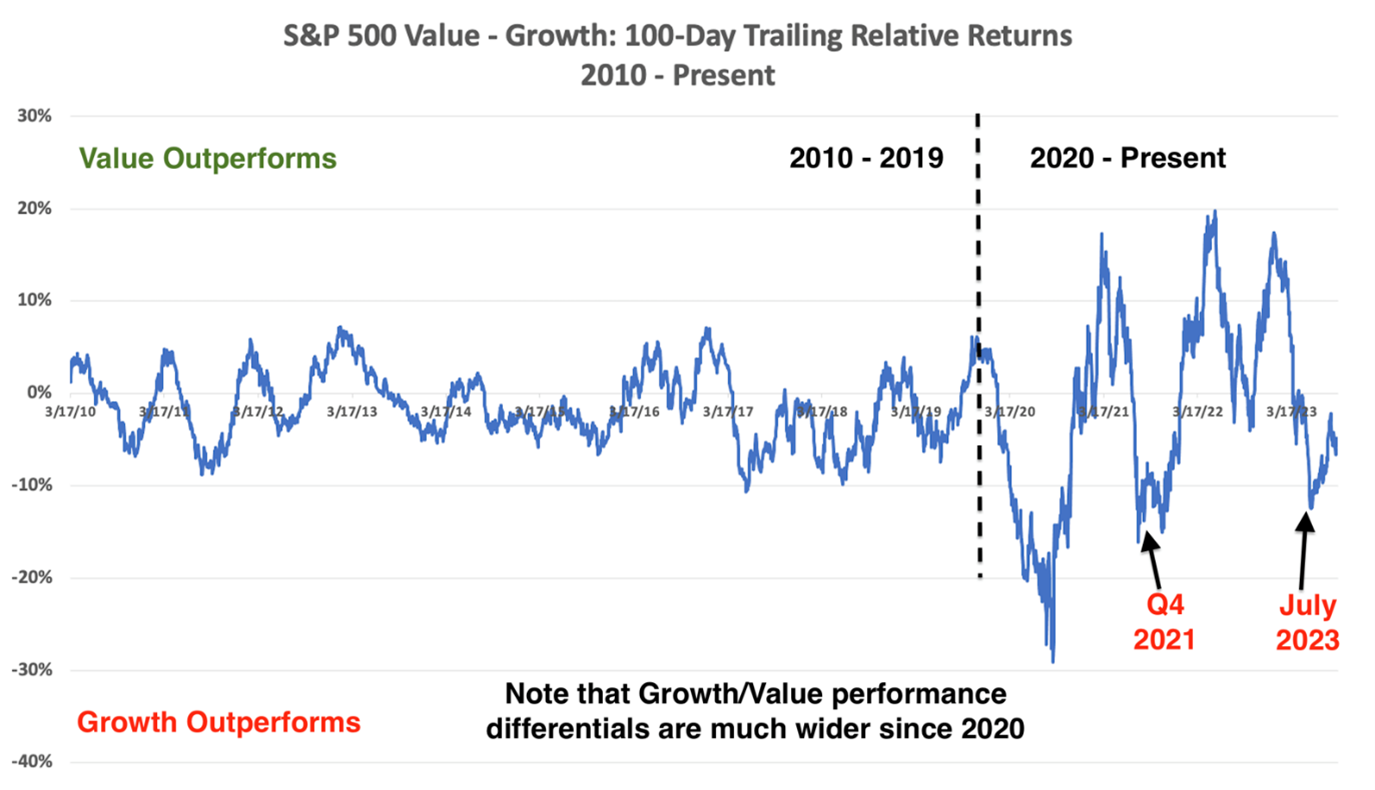 The chart above shows growth 100 day moving averages vs value, with value stocks performing better since the end of July. We do not think this is the beginning of a new bull market for value stocks however. As much as financials, industrials, materials and energy have lagged all year and will at some point begin to perform better, there is no clear catalyst to trigger a long term rotation away from growth in favour of value until we see inflation under control and interest rates in decline. Even then, the power of disruptive technology as it affects every aspect of our daily lives, will continue to attract investor capital with the promise of potential market-out-performing gains in the long term.
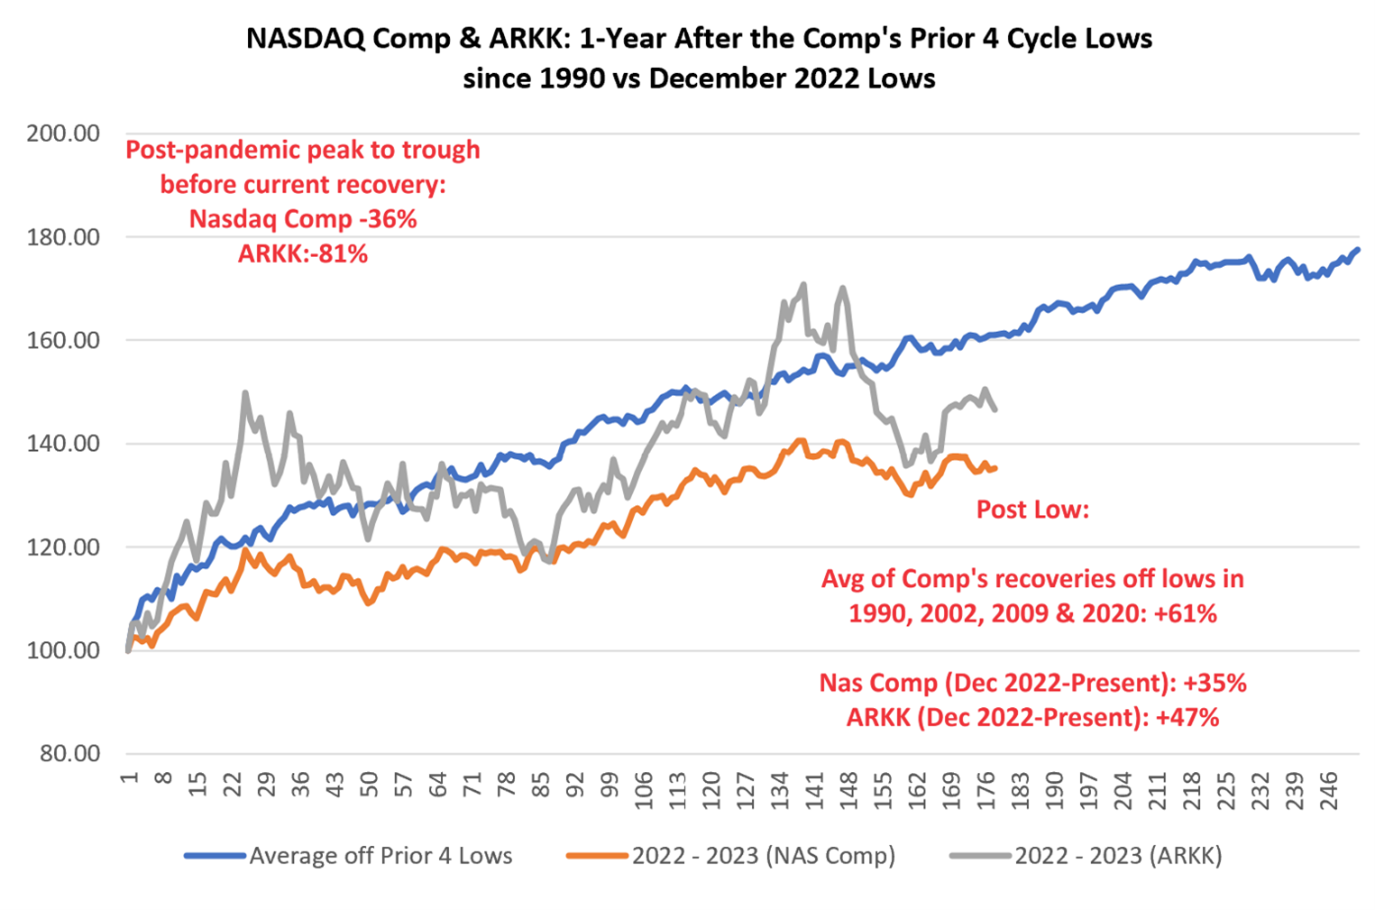
The graph above shows the one year rebound of the Nasdaq after the 4 previous market selloffs, and the current recovery in 2023. As you can see, we are significantly lagging prior recoveries due to the rising interest rate environment. Once we have stable or declining interest rates we would expect this gap to close, driving growth stocks higher.
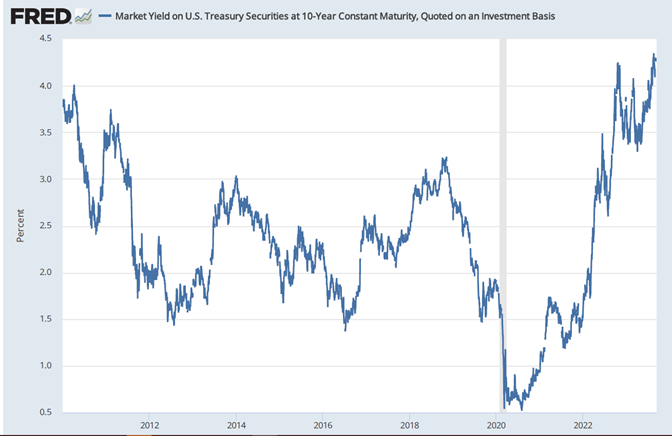
Interest rates have also been a big part of the recent market rotation, with 10 year US Treasury yields reaching levels not seen in 15 years, retesting the March 2023 highs. This makes equities worth less and also reduces the value of bonds. A key driver for a more broad market recovery is stable interest rates. You need look no further than the 10 year Treasury yield to know how equity markets are performing. As the chart below shows, we are now seeing rates consistently above 4% and each time the yield rises further, equities falter. We may receive the reassurance the market wants on interest rates later this month when the Federal Reserve makes it’s next interest rate decision. It’s widely expected that Jerome Powell, the Federal Reserve Chairman, will keep rates unchanged.
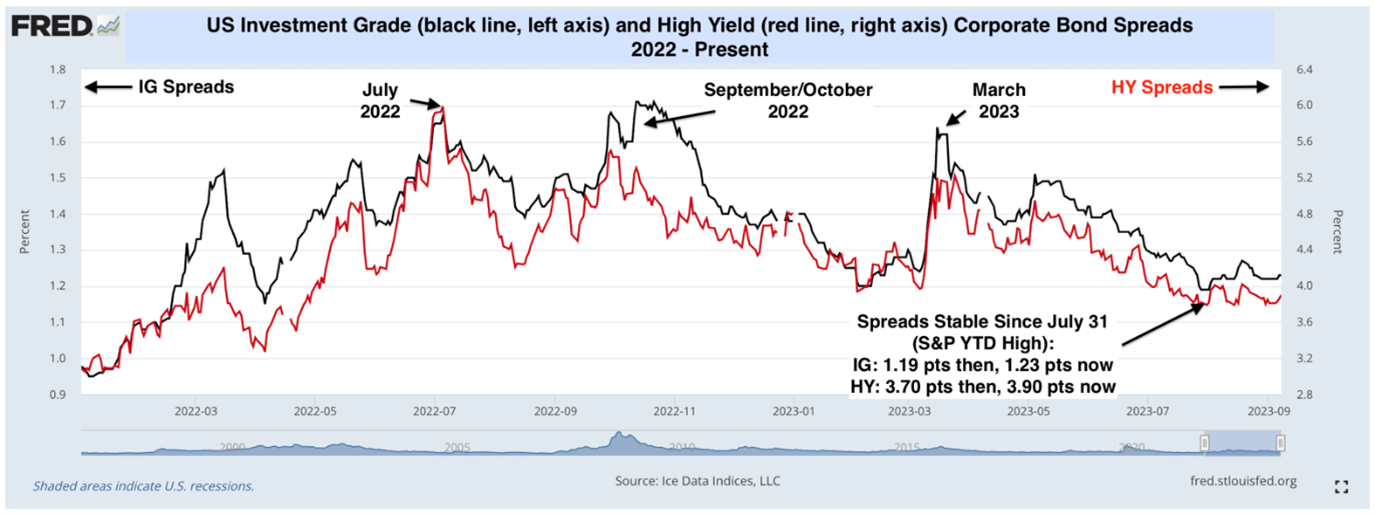
Another indicator of economic uncertainty is trending in a very positive manner, as it has all summer. Corporate and government bond spreads continue to remain tight, meaning the bond market is not pricing in any distress from corporate lenders, or government agencies. When there is doubt about these entities’ ability to repay their bond loans, these spreads rise, but as the chart below shows, they have been in decline since March, which was the peak of the US regional bank failures.
Canadian banks have not had the issues the US lenders have been dealing with, but the Canadian banks continue to struggle with slowing bank lending and a rise in provisions for credit losses (PCL). The Canadian bank stocks have slumped as a result. In the third quarter PCL ratios rose from 0.28 per cent to 0.35 percent. However, since 2000, the average for Canadian lenders is 0.41 percent, reflecting the very conservative nature of lending in this country and the propensity for Canadians to pay their debts. The Canadian banks as a group are down 22% this year, and as such, they already discount most if not all of the bad news around rising rates. Once we see stability in the rate environment, and perhaps rate cuts in 2024, there is a recovery opportunity for patient investors while they collect their dividends.
Finally, one of the most predictive factors in determining future stock prices is also showing signs of improvement. Earnings for the S&P500 stocks for 2024, based on estimates from all analysts covering these stocks, is currently trending higher for the first time in 6 quarters.
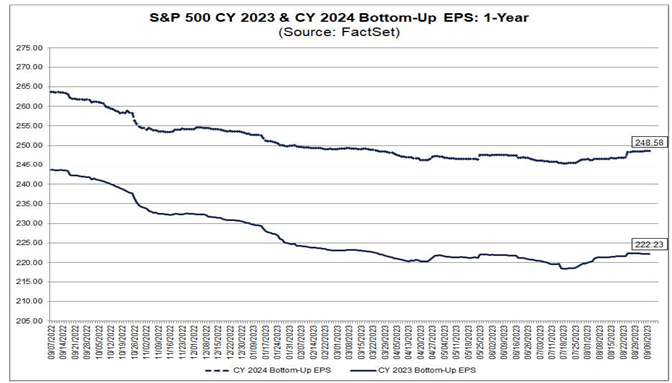
The chart above shows next year earnings estimates of 248, up from 222 in 2023. This represents a 12% yr/yr increase. Note the upward sloping curves since July, as analysts increase their earnings estimates for both this year and 2024. Historically analyst estimates start the year optimistically and tend to revise their forecasts lower as the year unfolds, but the trend indicates an improving economic setup for 2024. The markets always discount the earnings they expect 6 to 12 months into the future, so this improving trend, if sustained, will provide fuel for further market gains to year end.
If you have any questions about the information in this market update, or if you would like to arrange a meeting or phone call to review your portfolio, please call or email me or Terri or Andreas, and we would be happy to schedule a time to do so.
Best regards,
Gordon Forsey Advisory Group:
Gordon Forsey P.Eng., MBA, CIM, FCSI
Portfolio Manager, Sr. Wealth Advisor
Tel: 902-420-6203
Andreas Demone BBA
Client Associate
Tel: 902-420-9624
Terri MacPhail
Client Associate
Tel: 902-420-8263
CIBC Private Wealth consists of services provided by CIBC and certain of its subsidiaries, including CIBC Wood Gundy, a division of CIBC World Markets Inc. The CIBC logo and “CIBC Private Wealth” are trademarks of CIBC, used under license. “Wood Gundy” is a registered trademark of CIBC World Markets Inc.
This information, including any opinion, is based on various sources believed to be reliable, but its accuracy cannot be guaranteed and is subject to change. CIBC and CIBC World Markets Inc., their affiliates, directors, officers and employees may buy, sell, or hold a position in securities of a company mentioned herein, its affiliates or subsidiaries, and may also perform financial advisory services, investment banking or other services for, or have lending or other credit relationships with the same. CIBC World Markets Inc. and its representatives will receive sales commissions and/or a spread between bid and ask prices if you purchase, sell or hold the securities referred to above. © CIBC World Markets Inc. 2023.
Clients are advised to seek advice regarding their particular circumstances from their personal tax and legal advisors.


