February 06, 2024
Money Financial literacy Economy Good reads Commentary Quarterly update Quarterly commentary In the news NewsJanuary 2024 Market Commentary
As we turn the page and move into another calendar year I thought it would be a good time to provide some thoughts on where the markets might be heading this year and what to keep an eye on.
First, I’d like to recap how we ended the year in 2023 and the fourth quarter specifically. For most of 2023 I was telling clients that we would see a strong finish to the year with strong gains in the fourth quarter. That is exactly what happened. After bottoming on October 30th, the US markets rallied 7.3% in November and 4.4% in December, ending the year just shy of a new all-time high. With the January 19th close, the S&P500 is now trading at a new all-time high. In Canada, the TSX bottomed for the year on October 27th, and rallied 11.9% to year end, finishing the year up almost 8%.
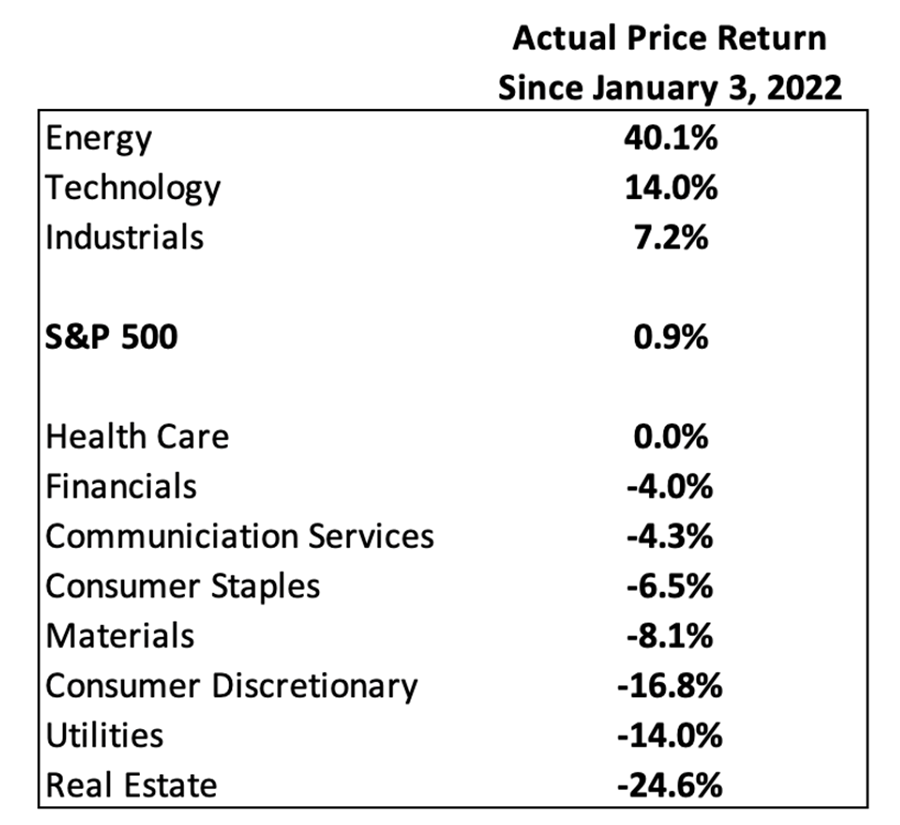
Most of the gains over the last year have been due to growth in technology stocks and the new developments in artificial intelligence. In fact, only three sectors are in positive territory since our last all-time high in Jan 3, 2022. They are energy up 40.1% (after being in a major slump in 2020 and 2021), technology up 14% and industrials up 7.2%. All other sectors are still below their last all-time highs. Consumer discretionary, real estate and utilities are the sectors down the most since January 2022. It is worth noting that the Russell 2000 (small cap stocks) has not made a new high since late 2021, MSCI EAFE (non-US developed economies) since mid 2007 (not a typo), and MSCI Emerging Markets since early 2021. Only the S&P 500 and the NASDAQ have done so, thanks to their overweight to disruptive technology. As veteran traders like to say, “What else do you need to know?”
With that brief review, let’s look forward to what we can expect in 2024.
One view is that we are now in a midcycle bull market similar to bull markets in the mid to late 1990’s, and again in 2012 to 2019. As with these prior bull markets, this cycle will be led by disruptive technology and challenged by low volatility, stable to somewhat lower interest rates, recovering earnings growth and a stable economy. In such an environment, large caps tend to out-perform small caps, with small cap out performance limited to periods when high yield spreads decline significantly, which is not the situation we face today.
Short term interest rates will once again this year be front and center in terms of what investors need to be watching. The market believes, based on Fed Funds futures contracts, with a significant probability that the FED will cut interest rates many times this year, as many as five or six times, which would take rates from 5.25% to 3.75%. This is part of the reason for the strong rally in the last two months of 2023. However, expectations for rate cuts are beginning to decline this month, causing some of the recent volatility in the markets. The US FED has been hinting they may cut 3 times, but even this is not a certainty. Similarly in Canada, the Bank of Canada does not want to cut interest rates before they are sure inflation is truly under control and back down to 2%. With inflation in Canada and the US still running above 3%, it could be quite some time before that happens, with wages, housing and food costs continuing to rise.
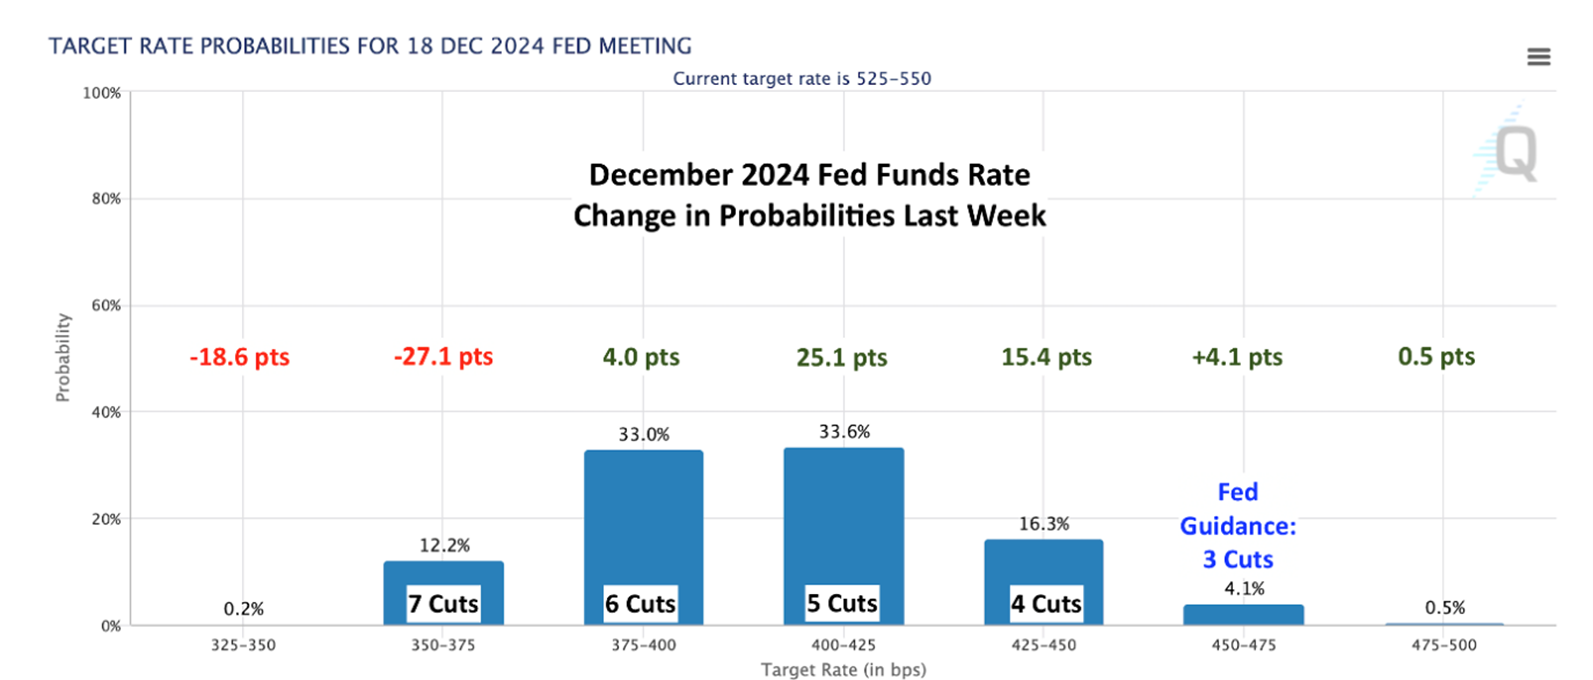
Any rate cuts could also be influenced by the US election calendar, with the FED not wanting to be seen to be interfering in the election by cutting rates near the election. So the window for the FED to cut rates is in the first 6 to 8 months of 2024.
The other factor to keep a close eye on this year is mega cap technology stocks. These names now dominate the S&P500 index, with about one third of the index in tech names and 27% in the Magnificent Seven (Amazon, Alphabet, Meta, Amazon, Tesla, Nvidia and Microsoft). As a result, these names must continue to deliver strong earnings and forward guidance if the broader averages are to perform well this year. Yes, energy stocks have done well over the last two years, but their weighting in the S&P500 index of 3.7% is too small to have a significant impact in either direction this year.
The following chart shows the relative one year rolling price returns between the Nasdaq100 and the S&P500 back to 2005. What does this chart tell us about positioning of technology stocks in 2024?
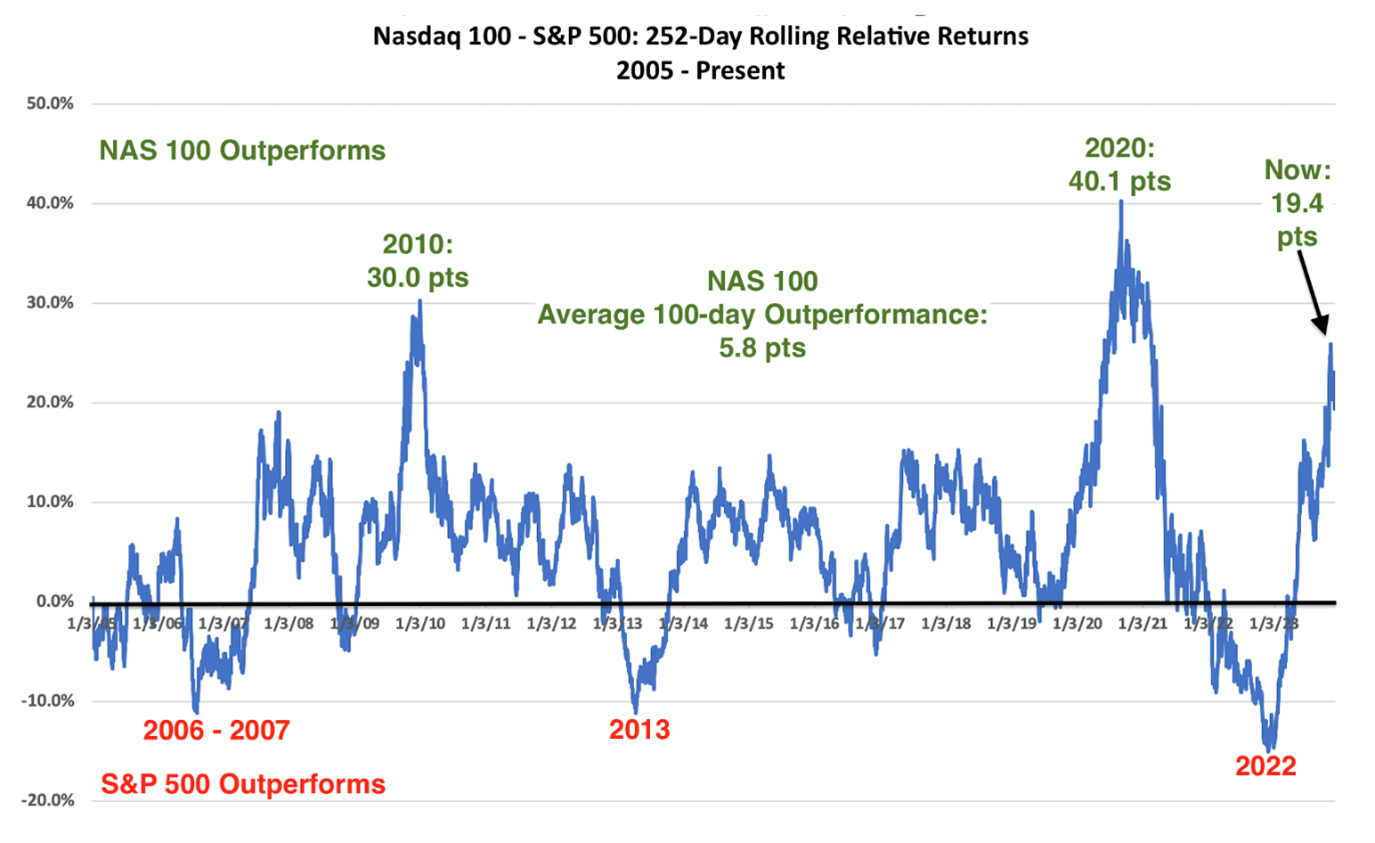
Firstly, history shows that the only reason to be underweight Tech is if the US economy is going to be so strong that capital moves to more cyclical sectors (2006-2007 and again in 2013), or if one expects interest rates to move significantly higher (2022). It was these factors that caused the tech-heavy Nasdaq to under-perform. It seems unlikely that either of these issues will be problematic for Tech stocks in 2024. Clearly, investor enthusiasm over generative AI has been a big part of the Nasdaq’s outperformance. This must continue for technology stocks to continue to outperform. But we need to temper our expectations given the outsized gains in 2023. A more realistic expectation might be that the Nasdaq beats the S&P by it’s long term average of 6%.
We continue to favor US technology companies both for the year ahead and over the long term. Technology companies are able to grow earnings consistently, allocate capital intelligently, and expand their competitive positions better than most publicly held businesses. Markets recognize this and reward Tech stocks accordingly. We see no reason why this will change in 2024 and beyond.
The other sectors which should do well in 2024 are shown below. All are expected to generate top line revenue growth that exceeds the S&P500 Index. These include financials, healthcare and consumer discretionary names. The laggards are utilities, materials and energy.

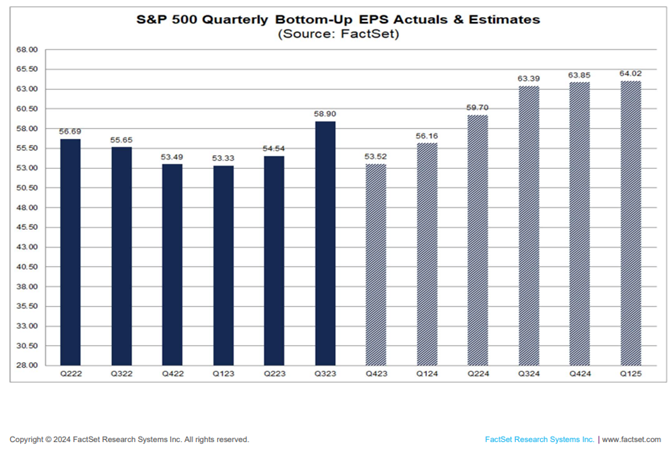
More generally, we also see positive indicators from expected earnings in 2024, currently showing about a 12% increase over 2023, and with this trend peaking in the last two quarters of the year. These estimates tend to decline somewhat as we work our way through the calendar year, but even a 8% earnings growth rate in 2024 puts us solidly in a bull market.
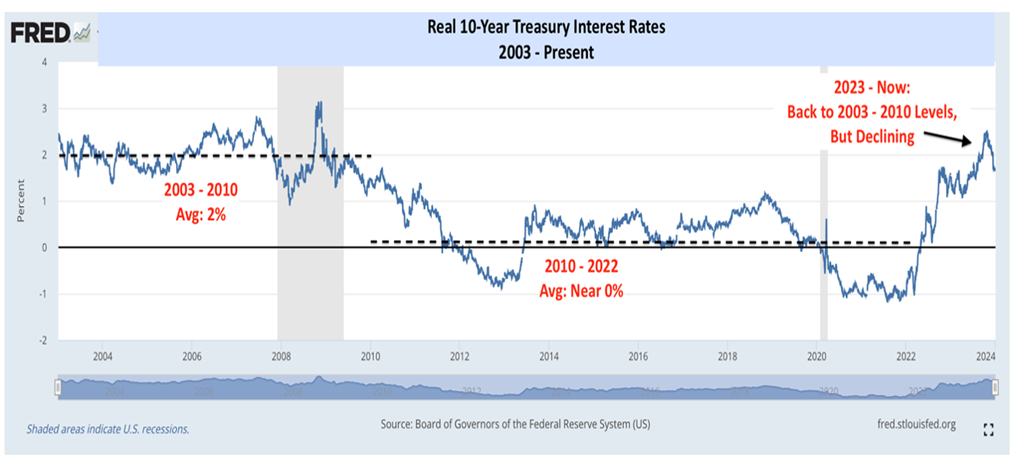
Long term rates are also an important driver of stock market returns. The 10 year Treasury yield forms the basis by which stocks’ future earnings and cash flows are valued in today’s dollars. The chart below shows the 10 year US Treasury yield adjusted for inflation (the real rate). Last year the markets reacted very strongly to any changes in the 10 year rate, and this year will be no different. If this rate remains stable or declines, this will help underpin any advances in the market this year and contribute to multiple expansion (ie, the value of stocks). The current yield is indicating a declining trend, and has room to go lower if inflation continues to decline towards the fed’s 2% target, all of which is positive for the stock market.
Finally, changes in credit spreads will be important to keep an eye on, as they tell us a lot about signs of stress in the financial markets.
The following chart shows the difference between BBB corporate bond spreads and those for all investment grade (IG) bonds from 2017 to the present. Relative spreads reflect the incremental risk investors see in owning marginal bonds rather than the IG bond index as a whole. Higher/lower differences point to loss/more confidence in the US economy.
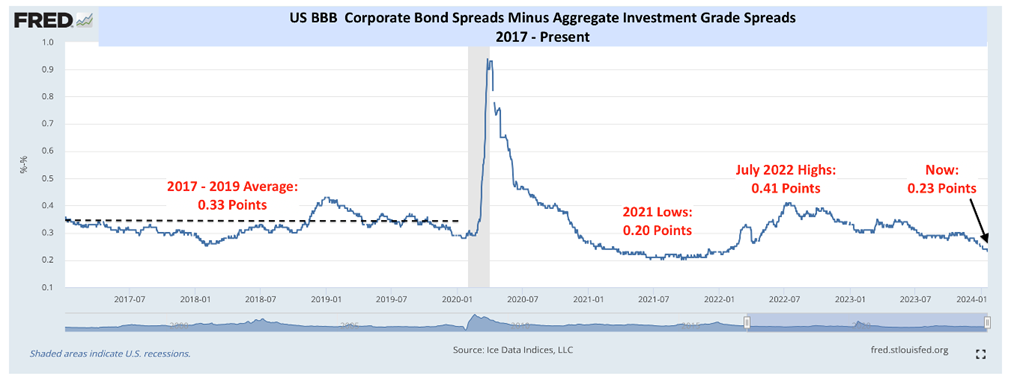
Takeaway (1): The US corporate bond market is every bit as bullish on the US economy as stocks, but it is actually sending an even more positive signal since Generative AI is not a part of its bull case. Technology is just 10 percent of the BBB corporate bond index. Consumer Staples (17 pct), Communications (16 pct), and Energy (10 pct) all have the same or greater weighting and Cyclicals (Consumer/Industrials and Financials) make up 23 percent of the index.
Takeaway (2): One can look at this as either good or bad for stocks. A pessimist might say the corporate bond market is too confident about the 1–2-year outlook for corporate fundamentals, and there is something to that point. We seldom see BBB/IG relative spreads stay at current levels without central bank printing money (an unlikely event in 2024). The optimistic camp, which is our view, will counter that relative spreads can meander their way higher without flashing a recessionary warning sign. This has happened many times in the past, and stocks still worked their way higher.
As always, if you would like to discuss any of the material, or if you would like to review your current portfolio as we head into 2024, please do not hesitate to contact me or any member of my team and we can arrange an in-person meeting, Teams video conference call, or a telephone call to discuss your investments.
Gordon Forsey
™Trademark of CIBC World Markets Inc. CIBC Wood Gundy will be responsible to CIBC Wood Gundy Investment Consulting Service clients for the advice provided by any Investment Manager. The ICS Program Manager, CIBC Asset Management Inc., is a subsidiary of CIBC. This material comes from the computer calculations of Gordon Forsey. In the event of a discrepancy between the data used in this report and the data generated by CIBC Wood Gundy, reliance must be placed on the data generated through the facilities of CIBC Wood Gundy. Yields/rates are as of the above date and are subject to availability and change without notification. Minimum investment amounts may apply. Insurance services are available through CIBC Wood Gundy Financial Services Inc. In Quebec, insurance services are available through CIBC Wood Gundy Financial Services (Quebec) Inc. Clients are advised to seek advice regarding their particular circumstances from their personal tax and legal advisors. CIBC Wood Gundy is a division of CIBC World Markets Inc
Clients are advised to seek advice regarding their particular circumstances from their personal tax and legal advisors.
Insurance services are available through CIBC Wood Gundy Financial Services Inc. In Quebec, insurance services are available through CIBC Wood Gundy Financial Services (Quebec) Inc.
This report is not an official record. The information contained in this report is to assist you in managing your investment portfolio recordkeeping and cannot be guaranteed as accurate for income tax purposes. In the event of a discrepancy between this report and your client statement or tax slips, the client statement or tax slip should be considered the official record of your account(s). Please consult your tax advisor for further information. Information contained herein is obtained from sources believed to be reliable, but is not guaranteed. Some positions may be held at other institutions not covered by the Canadian Investor Protection Fund (CIPF). Refer to your official statements to determine which positions are eligible for CIPF protection or held in segregation. Calculations/projections are based on a number of assumptions; actual results may differ. Yields/rates are as of the date of this report unless otherwise noted. Benchmark totals on performance reports do not include dividend values unless the benchmark is a Total Return Index, denoted with a reference to 'TR' or 'Total Return'. CIBC Wood Gundy is a division of CIBC World Markets Inc., a subsidiary of CIBC.
Commissions, trailing commissions, management fees and expenses all may be associated with mutual fund investments. Please read the prospectus before investing. The indicated rates of return are the historical annual compounded total returns, including changes in unit value and reinvestment of all distributions and do not take into account sales, redemption, distribution or optional charges or income taxes payable by any security holder that would have reduced returns. Mutual funds are not guaranteed. Their values change frequently, and past performance may not be repeated.
This information, including any opinion, is based on various sources believed to be reliable, but its accuracy cannot be guaranteed and is subject to change. CIBC and CIBC World Markets Inc., their affiliates, directors, officers and employees may buy, sell, or hold a position in securities of a company mentioned


