
Aaron Sherlock
August 13, 2025
Money Education Financial literacy Economy Monthly update Monthly commentary In the news


Cracks in the Employment Market - Economic Update
Read the entire piece or skip directly to these sections:
As the world continues to gain clarity on the tariff front, both businesses and nations alike are actively pivoting to minimize the impact. However, the persistent uncertainty makes strategic planning challenging, leading many companies to rightsize their workforce in an effort to maintain profitability. This trend is reflected in the most recent jobs reports from both Canada and the U.S., which highlight the ongoing adjustments across industries. Meanwhile, Europe is contending with its own economic slowdown, as the Eurozone’s economy shows signs of weakening, and Asia is facing similar headwinds with exports from China and Japan decelerating. It’s important to remember, however, that much of this is lagging data—significant progress has been made on the tariff front in recent weeks. With that in mind, let’s examine the following data points with a degree of caution.
United States Economic News

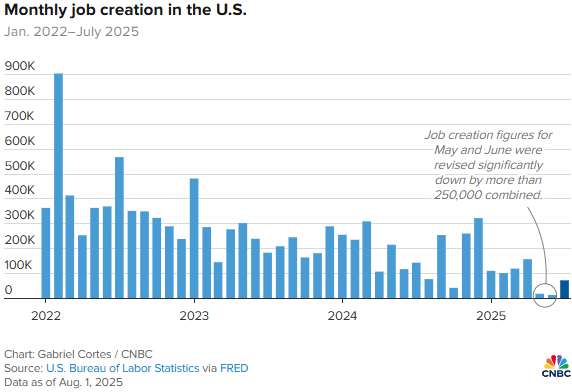
1. Cracks in the employment market
Amid ongoing economic uncertainty, the latest U.S. jobs report offers important insights into the shifting labor market. While headline figures show slower job growth and rising unemployment, sector-specific trends and wage gains reveal a more complex picture of resilience and adjustment.
Key data
- The number of jobs added in July totaled 73,000 versus the 100,000 expected
- The unemployment rate climbed to 4.2%
- May and June job gains were revised down by a combined 258,000
- The top sectors for job gains included Healthcare & Social Assistance, Retail, and Financial Services
- Wage growth was slightly higher than anticiped at 3.9% year-over-year versus the expected 3.8%
- Labor force participation dropped to 62.2%, which is the lowest since November 2022
Conclusion
Taken together, these figures underscore a labor market in flux—characterized by slowing job growth, rising unemployment, and declining participation. However, the resilience in sectors such as Healthcare and Financial Services, along with steady wage gains, suggests that pockets of strength remain. As the economic landscape continues to shift, closely monitoring these indicators will be critical for anticipating future trends and informing policy and business decisions. The evolving data highlights the importance of a nuanced approach to interpreting labor market health in the months ahead.
U.S. Monthly Job Creation (as of August 1, 2025)
2. Auto sales fueled by tariff uncertainty
Amid ongoing economic uncertainty, U.S. vehicle sales showed a strong rebound in July, surpassing expectations and signaling resilience in the auto sector. While automakers have managed to absorb recent tariff impacts, future sales may face headwinds as higher prices reach consumers and broader economic challenges persist.
Key Data
- Monthly vehicle sales (annualized) hit 16.4 million units in July, which is up 7.1% month-over-month and above the 16.0 million expected
- Average daily sales rose to 52,695, which is 2.5% above those average daily sales for July 2024
- Passenger vehicle sales were down 11.5% year-over-year
Conclusion
Looking ahead, while the new One Big Beautiful Bill Act may support sales through auto loan interest deductions, rising prices and a slowing labor market are likely to temper growth. Sales are expected to moderate but remain near 16.0 million units on average for the remainder of the year.
3. Existing home sales continue to face headwinds
U.S. existing home sales continue to face significant challenges, with recent data highlighting both supply improvements and ongoing affordability concerns. Despite a modest increase in inventory, higher mortgage rates and rising prices are weighing on buyer activity.
Key Data
- June home sales: Fell 2.7% from May (vs. 0.7% increase expected); flat year-over-year
- Homes for sale: 1.53 million, up 15.9% from a year ago
- Median home price: $435,300 (up 2.0% y/y)
- Mortgage rates: 30-year fixed rate returned to the 7% range
- Months of supply: Increased to 4.7 months (still below the historical average of 6 months)
Conclusion
While increased inventory and a higher months-of-supply figure suggest the market is loosening, elevated mortgage rates and home prices continue to limit affordability and dampen sales activity. The housing market’s recovery will likely depend on further improvements in affordability and a sustained increase in available homes.
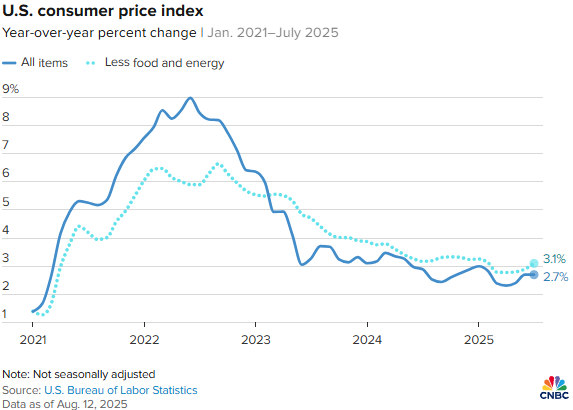
4. Inflation continues to ease
The latest U.S. CPI report suggests inflation remains largely under control, supporting expectations that the Federal Reserve is still on track for a potential rate cut in September. While core inflation ticked up slightly, the overall data aligns with market forecasts and indicates limited immediate concern.
Key Data
- Headline CPI (including food & energy): 2.7% year-over-year, matching expectations and slightly below the 2.8% forecast
- Core CPI (excluding food & energy): Rose to 3.1% year-over-year, a bit higher than anticipated
- Household goods: Saw price increases due to tariffs
- Auto sales: Remained steady despite tariff impacts
Conclusion
Although tariffs continue to influence certain categories, the overall inflation picture is stable. This report reinforces the outlook for a September rate cut, with inflation trends generally moving in the right direction.
Year-Over-Year Change in the U.S. Consumer Price Index (as of Aug 12, 2025)
Canadian Economic News

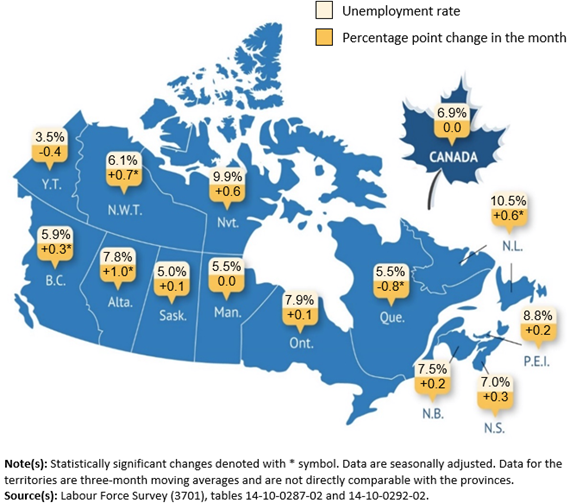
1. Tariff uncertainty impacting employment
Canada’s July employment data revealed unexpected weakness, with job losses concentrated among younger workers and key sectors, despite steady wage growth and an unchanged unemployment rate. The details highlight ongoing challenges for the labor market.
Key Data
- Jobs lost in July: 40,800 (vs. expectations for a gain of 13,500)
- Unemployment rate: Held steady at 6.9%
- Youth employment (ages 14–24): Employment rate dropped to 53.6%, the lowest since 1998
- Sectors with largest losses: Recreation and construction
- Wage growth: Up 3.3% year-over-year
Conclusion
These figures underscore the fragility of Canada’s labor market, particularly for younger workers and in sectors sensitive to economic shifts. While wage growth offers some support, persistent job losses may continue to weigh on employment prospects in the coming months.
Canadian Unemployment Rate (as of August 8, 2025)
2. Homes sales showing signs of life
Canada’s housing market showed tentative improvement in July, with home sales picking up on a monthly basis despite remaining below last year’s levels. Inventory conditions tightened slightly, while average prices edged up year-over-year.
Key Data
- July home sales: Up 3.8% from June, but down 3.4% compared to June 2024
- Average months of inventory: Decreased to 4.4, just below the long-term average of 5 months
- Average home price: Rose 0.6% year-over-year
Conclusion
These figures suggest some renewed activity in the market, though prices reversed the recent decline and lower annual sales highlight continued headwinds for both buyers and sellers.
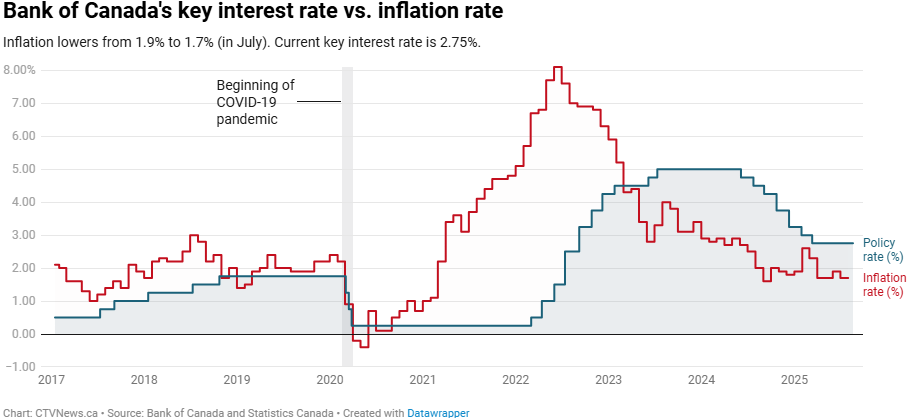
3. Consumer inflation steadies
Inflation in Canada eased in July, primarily due to lower gas prices, though rising grocery and shelter costs continued to put pressure on households. The Bank of Canada will closely monitor these trends ahead of its next interest rate decision.
Key Data
- Headline Inflation: Annual inflation fell to 1.7% in July from 1.9% in June, largely driven by a 16.1% year-over-year drop in gasoline prices.
- Grocery and Shelter Costs: Grocery prices rose 3.4% year-over-year, up from 2.8% in June, with notable increases in confectionery and coffee. Shelter inflation accelerated to 3.0%, led by higher rents in several provinces
- Core Inflation: The Bank of Canada’s preferred core inflation measures remained steady around 3% in July
- Average home prices: Fell 3.7% year-over-year
- Outlook: The central bank is expected to weigh these mixed inflation signals as it prepares for its next policy meeting in September
Conclusion
While overall inflation has moderated, persistent increases in essential categories such as groceries and shelter highlight ongoing cost pressures for Canadians. The Bank of Canada’s upcoming decisions will be critical in shaping the economic outlook for the remainder of the year.
Canada’s Inflation Rate (as of Aug 19, 2025)
Global Economic News

1. German economy slows
Germany’s economy showed renewed signs of weakness in Q2, with growth slipping into negative territory following a period of pre-tariff activity. Despite recent trade agreements, ongoing stagnation remains a concern for Europe’s largest economy.
Key Data
- GDP growth: Contracted by 0.1%, in line with expectations after the pre-tariff boom
- Trade developments: The recent U.S.– Eurozone agreement offers some support, but Germany is still likely to feel the brunt of ongoing economic challenges
Conclusion
These figures suggest some renewed activity in the market, though prices reversed the recent decline and lower annual sales highlight continued headwinds for both buyers and sellers.
2. U.K. economy surprises to the upside
The U.K. economy posted better-than-expected growth in the second quarter, according to preliminary estimates from the Office for National Statistics. However, economists caution that this momentum is unlikely to persist, as underlying challenges and uncertainties continue to weigh on the outlook.
Key Data
- Stronger Q2 Growth: GDP expanded by 0.3% in the second quarter, exceeding the consensus forecast of 0.1%. This follows robust growth of 0.7% in the first quarter.
- Monthly Trends: June saw a 0.4% increase in economic activity, rebounding from a 0.1% contraction in May, despite ongoing headwinds from U.S. tariffs and business uncertainty.
- Cautious Outlook: Factors such as a softening labour market, capacity constraints, global economic weakness, and the lingering effects of recent tax changes are expected to limit growth.
- Policy Implications: With inflationary pressures persisting and growth prospects uncertain, the Bank of England is expected to keep interest rates on hold for the remainder of the year.
Conclusion
While the U.K. economy demonstrated resilience in the second quarter, the outlook remains cautious. Economists anticipate that growth will moderate in the coming months due to both domestic and global headwinds. The risk to growth forecasts for 2025 may be slightly to the upside, but persistent challenges suggest that a sustained rebound is unlikely in the near term.
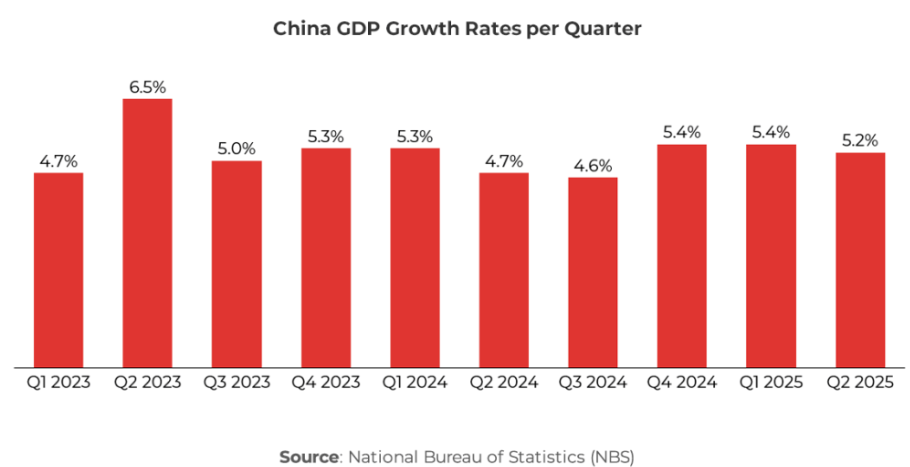
China's Q2 GDP Beats Expectations
China’s economy continued to show resilience in the second quarter, with GDP expanding by 5.2%—slightly ahead of expectations and keeping the country on track to meet its full-year growth target of 5%. While industrial output outperformed forecasts, other key indicators pointed to a more mixed picture, with retail sales growth slowing and fixed asset investment underperforming expectations. Policymakers are expected to maintain a cautious approach to additional stimulus, monitoring both domestic consumption trends and external trade developments as the year progresses.
Key Data
- GDP Growth: Expanded by 5.2% in Q2, beating expectations but slowing from 5.4% in Q1
- Mixed Sector Performance: Industrial output exceeded forecasts, while retail sales growth slowed and fixed asset investment underperformed expectations.
- Real Estate and Consumption: Real estate investment declined further, but domestic consumption’s share of GDP increased, supporting overall growth.
- Policy Outlook: Policymakers are expected to maintain a cautious stance on new stimulus, focusing on targeted support and monitoring trade developments.
Conclusion
While China’s headline growth remains robust, the underlying data reveals ongoing challenges, particularly in consumer spending and real estate investment. Policymakers are likely to continue a measured approach, providing targeted support as needed while monitoring the impact of global trade tensions and domestic economic conditions. The government’s 5% growth target appears achievable, but sustained momentum will depend on further improvements in consumption and stabilization in key sectors.
Chinese Economic Growth (as of Jul 15, 2025)
Related posts
Aaron Sherlock
September 12, 2025
Earnings Exceed Expectations but Tariffs Loom Large - Q2 2025
Over 90% of S&P 500 firms have reported Q2 2025 results. Despite trade wars and geopolitical tensions, earnings remain strong, but future outlook continues to matter more than past performance.
Read moreCIBC Private Wealth
February 03, 2026
Approaching family legacy conversations with intention
Conversations about family wealth carry both emotional and financial weight. But open dialogue with your parents, and expert guidance, can help strengthen your family’s legacy for generations to come.
Read more