Peter White / Greenwood White Group
January 24, 2024
More Than Meets the Eye
We thought we’d try something new this month by sharing some graphics that caught our eye over the past few weeks in our daily review of analyst reports, print media, the blogosphere, and the myriad other information sources we tap into to formulate our views on the markets and provide you with timely and informed advice.
Canada’s Housing Market
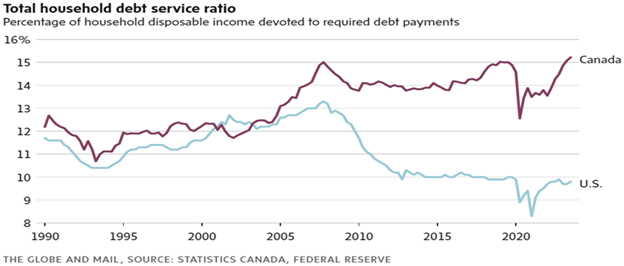
This subject rightfully absorbs a lot of air time, as most Canadians’ principal residence comprises their largest asset by value. Are we in a housing crisis? And if so, what are the drivers of house prices? One factor that we look at is the amount that the average household devotes to servicing their debt. A clear disconnect started to build after the Global Financial Crisis of 2008 – 2009; Canada’s banking system emerged largely unscathed, and Canadians kept increasing their leverage as borrowing rates fell. The new rate enviroment has to be a painful adjustment period for many Canadian consumers.
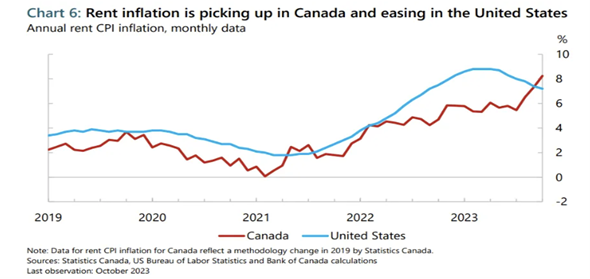
But Canada’s housing “crisis” has some unexpected consequences. As borrowing rates have increased (to combat inflation), developers have found it more expensive to bring new projects into development. Meanwhile, our population continues to grow, causing rents to rise. Rising rents leads to rising inflation. Rising inflation makes it difficult for the Bank of Canada to lower rates. This is a conundrum we expect our central bankers to face in the years ahead.
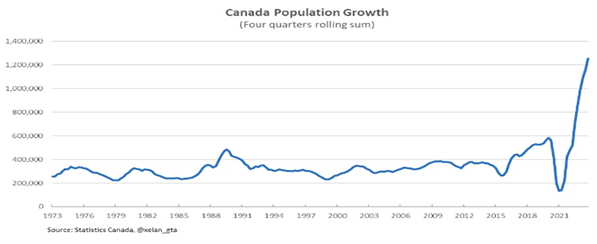
And there is little doubt that Canada’s recent population growth is clearly well above average.
But maybe that is not all bad? If economic growth boils down to the growth in the population plus the growth in productivity (a measure of the amount of GDP each individual produces), then Canada (and the U.S.) are in decent shape relative to our OECD peers (and China).
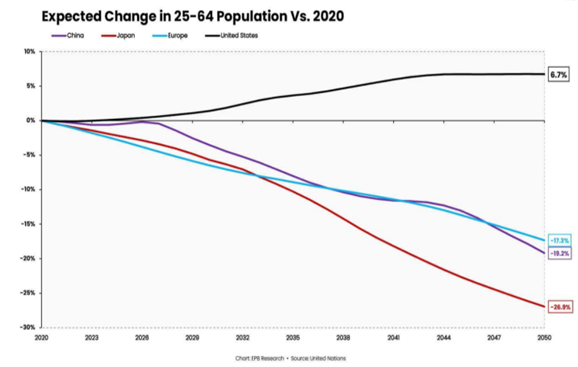
The chart above (from the United Nations, no less) implies that China may soon join the ranks of Japan and Europe, which have struggled to find sustainable growth over the past few decades.
Nation-Sized Companies
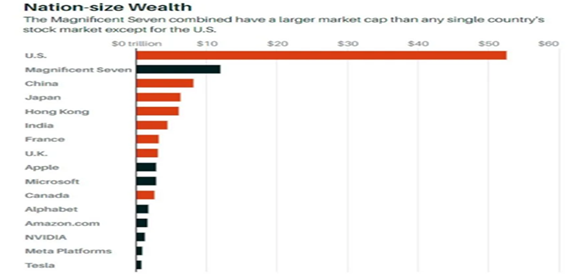
Speaking of not-so-small nations, a lot of ink has been spilled over the so-called “Magnificent 7” – the seven largest stocks which have dominated the returns of the U.S. markets over the past decade. As you can see in the chart below, these 7 companies combined have a larger market cap than any single countries entire stock market (USA excluded).
And while a lot of that market cap is attributable to the gargantuan earnings power of these tech giants, they have also witnessed a sizeable jump in their valuation, such as the amount an investor is willing to pay for every dollar of earnings they are expected to produce.
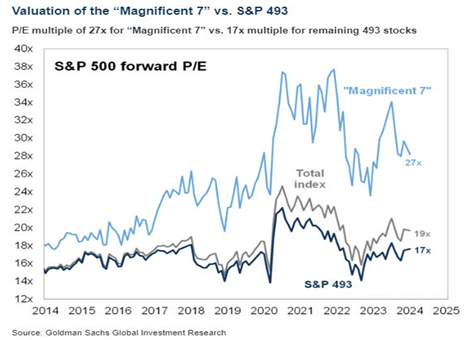
If we strip out those seven stocks from the S&P 500 index, which tracks the largest 500 U.S. Stocks, the “S&P 493” trades for 17x earnings, which is not far off its 30-year average of 16.6x. Maybe the U.S. market isn’t that expensive after all.
Big Tech & AI
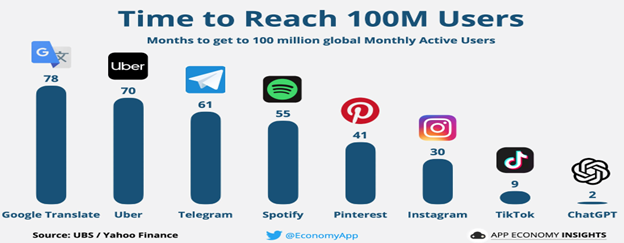
And scale matters, particularly in tech. 2023 was the year where AI made a big splash, as ChatGPT became a household name, and was downloaded by 100,000,000 users in a mere two months, driving the stocks of big tech beneficiaries like Google, Microsoft, Meta, Amazon and Nvidia meaningfully higher. Here’s how long it took some other familiar platforms to reach that milestone:
But all of these users (and the massive data mining this entails) also means a huge amount of processing power. To date, the cost of bringing additional processing power online has been *relatively* inexpensive as most server farms run off of 12 - 16 nanometer chips, which *only* cost a cool USD$106MM to design. However, as processing demands rise, so will electricity and performance demands. Smaller chips are a solution, but the cost to design them is sky-rocketing, and only a handful of companies have the scale and budget to pursue them. To put the chart below in context, Nvidia’s Research & Development budget is currently USD$7B/year, and the cost of a 3nm chip is estimated to be between USD$500M – USD$1.5B (the chart below ends at 5nm). Is it realistic to assume they’ll spend 20% of their annual budget on chip design for high end GPUs?
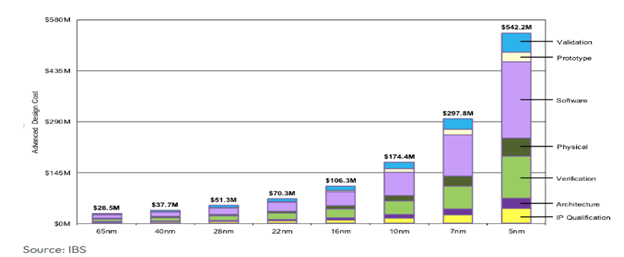
But a $1.5B chip design is only a fraction of the annual R&D budget of the big tech platforms like Amazon, Google, Meta, Apple and Microsoft.
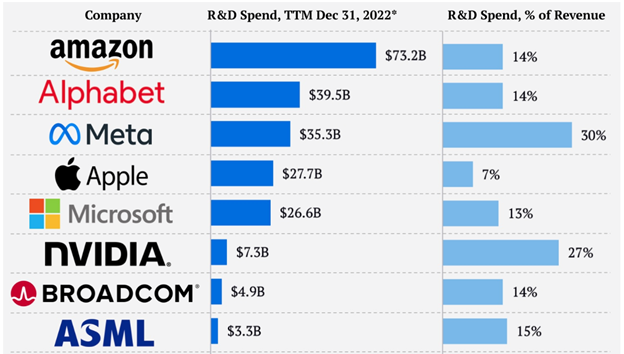
(source: The Visual Capitalist)
The bottom line
It’s a fast-paced, confusing time but when is it not a fast-paced, confusing time? We find stepping back a few feet and thinking about the big picture can often allow the little details to come into focus. Or, as Cameron Crowe once quipped (via Jeff Spicoli): “Life comes at you pretty fast. If you don’t stop and look around once in a while, you could miss it.” (Fast Times at Ridgemont High)


