
David Ricciardelli
October 04, 2022
Money Financial literacy


Looking Beyond an Ugly 3Q 2022
Investing in volatile markets is painful. As humans our evolution wasn’t focused on investing. Saving for retirement has only been a concern for a few generations, as life expectancies began to exceed our working lives, and our fight-or-flight wiring doesn’t lend itself to being opportunistic in scary environments.
It’s difficult to maintain a long term perspective when sentiment is terrible. Especially, with the constant barrage of ‘doom porn’ as the media tries to outdo itself with both negative headlines and negative perspectives. The silver-lining is that it’s always darkest before dawn and there is some historical context that suggests dawn may be on the horizon.
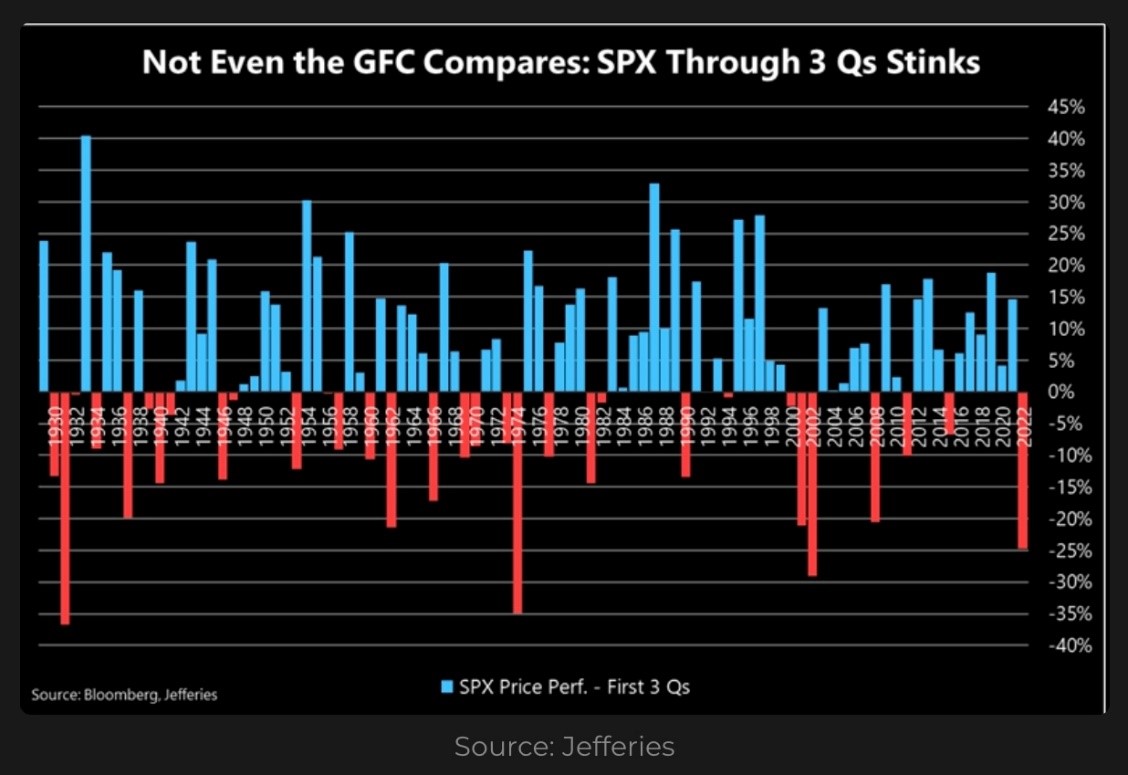
How ugly has 2022 been?
The S&P 500 just had its fourth worst nine-month start to a year since 1930. The last nine months were worse than the Global Financial Crisis (2008).
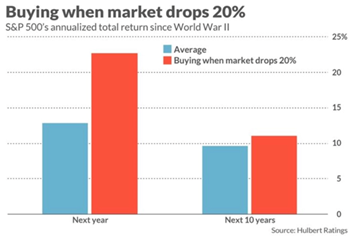
In September, the S&P500 fell 9.2% (total return) making it the worst September since 2002 and the worst month since the start of the pandemic in March 2020. With the market back at the bear market lows, much of what we wrote on June 21st in Panic! It’s a Bear Market is back in play. The main takeaway from the note is while we don’t know what markets will do in the short term, investors who’ve bought the S&P 500 following 20% pullbacks or when sentiment was very negative have usually done well if their time horizon is more then twelve months.
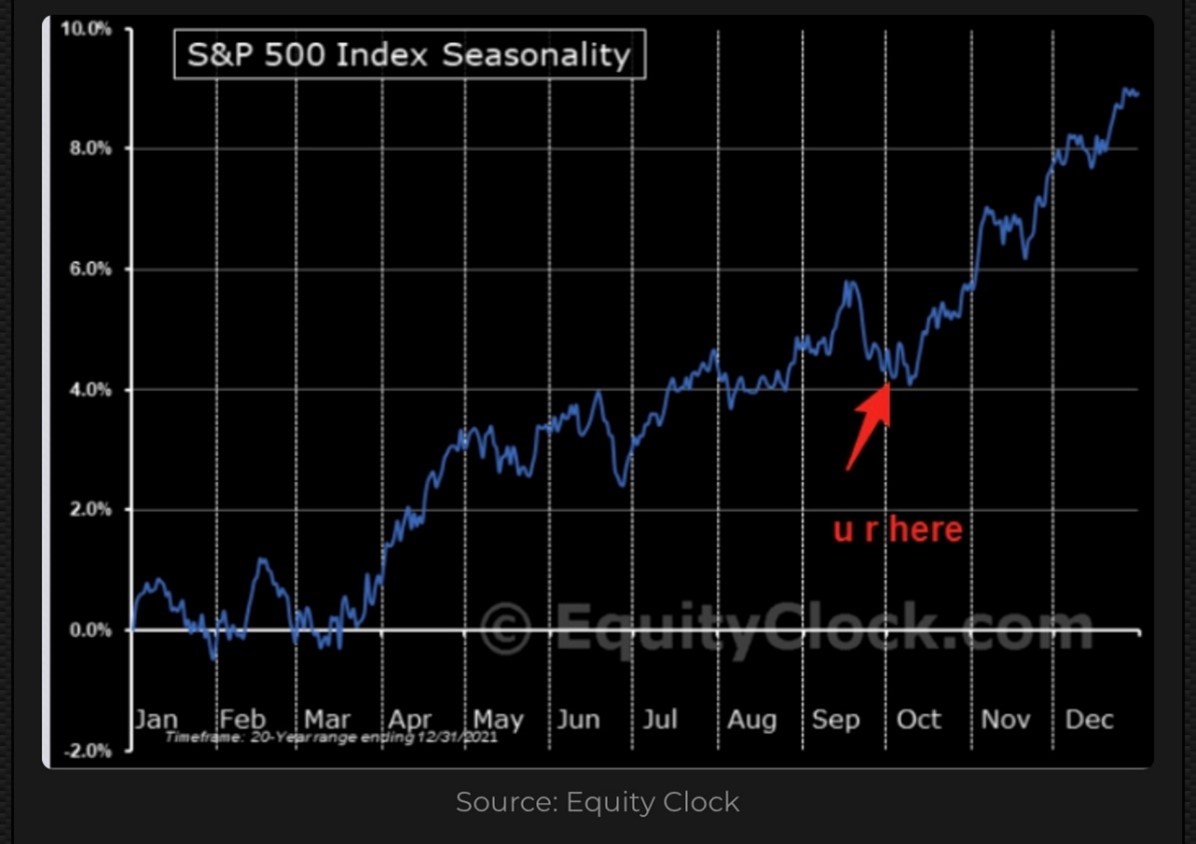
What does seasonality look like?
Seasonality for the S&P500 improves as we move into October. Scott Rubner from Equity Clock highlights that “Since 1928, the best day to buy the market heading into Q4 is actually September 30th”.
S&P500 Seasonality Over the Past 20 Years
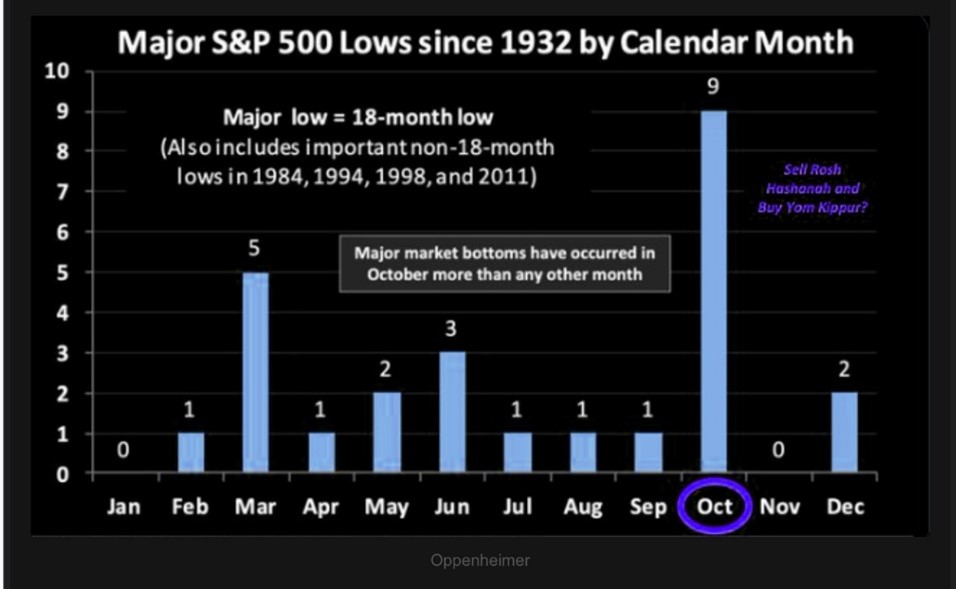
October has also been the ‘low’ in an S&P500 market cycle more often than any other month.
How fast could this market bounce?
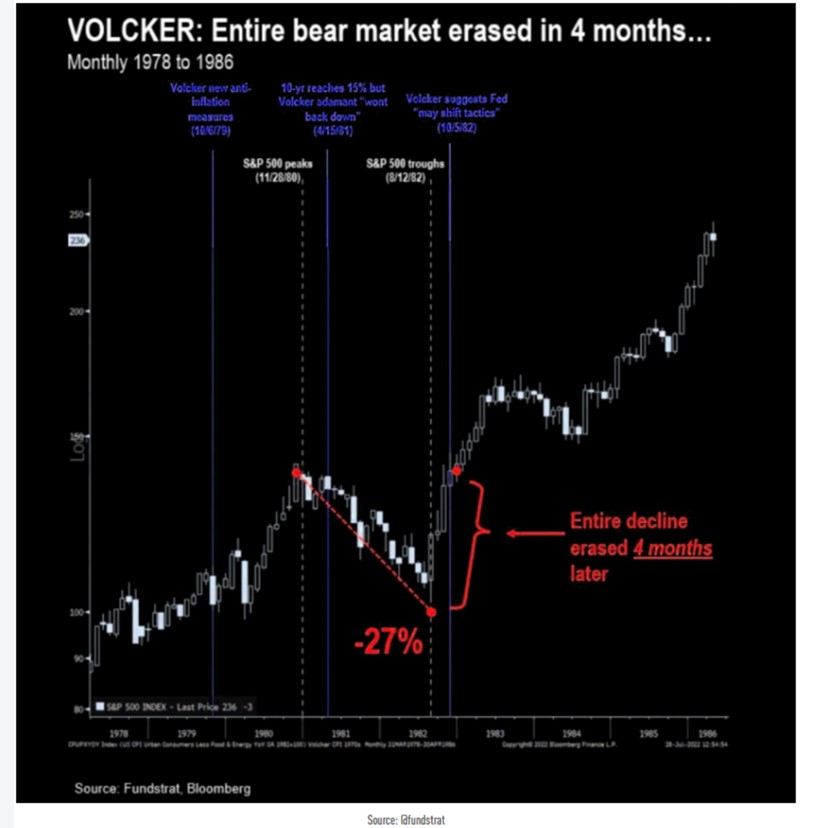
The last time the Fed significantly raised rates to combat inflation was the Volcker Fed in 1979-1982. The rate hikes contributed to an almost two-year bear market that saw the S&P500 decline 27%. The S&P500 then started to rally about four-months before Volcker suggested the Fed “may shift tactics”. The market had almost recovered the bear market losses and made new highs by the time Volcker suggested a shift in tactics; the S&P500 then went on to a five-year bull market.
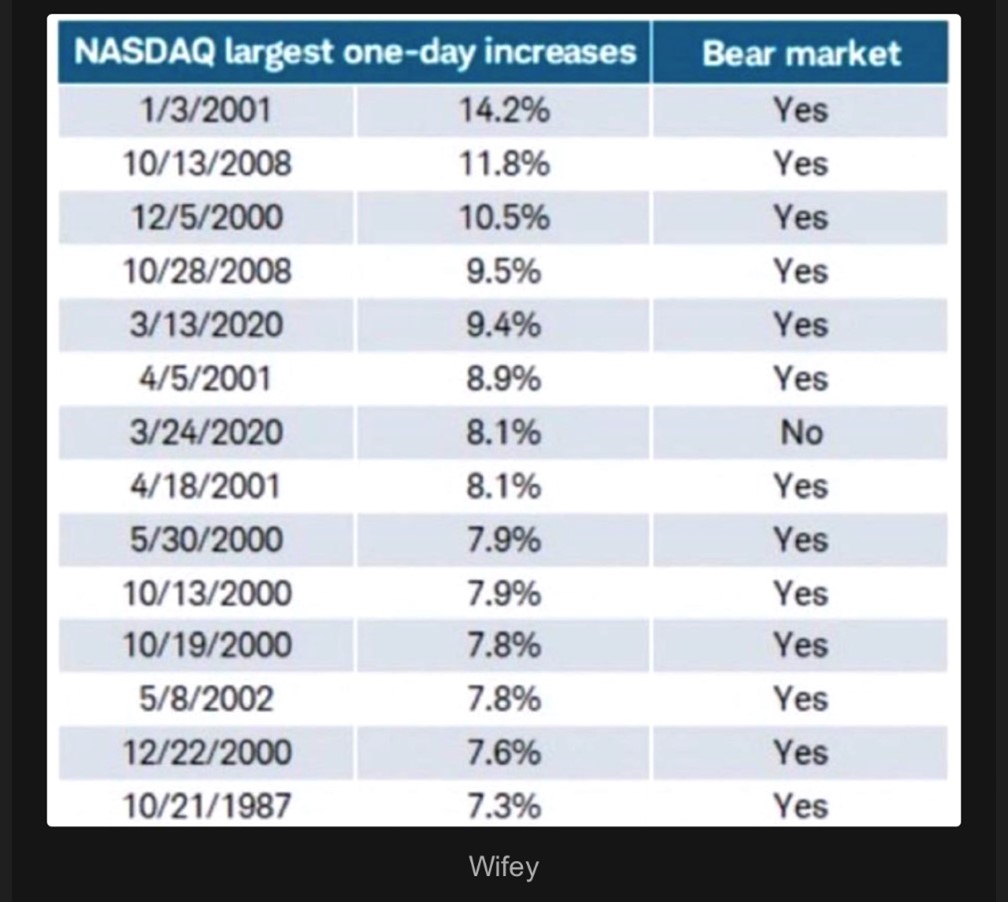
Technology stocks also love to rally in October. Five of the Fourteen largest one-day tech rallies have occurred in October, and while 2022 has been a year for the record books we would need to see the NASDAQ jump 7.3% in a single session to make the list below.
What type of recession will we have?
While I can’t recall an instance where I’ve seen consensus successful call a US recession, we’ll focus on putting recessions into context.
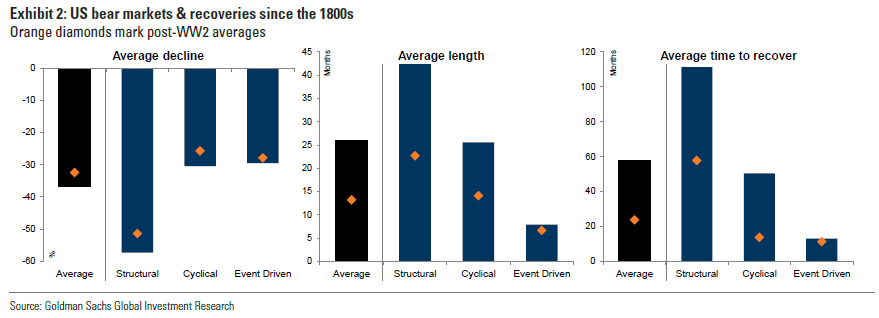
Recessions can typically be categorized as structural, event driven, or cyclical. Structural recessions are caused by large imbalances (read ‘bubbles’) in the economy. Event driven recessions are caused by an exogenous event. While Cyclical recessions are the result of higher interest rates impacting both supply and demand. Structural and event driven recessions tends to be deeper and longer than cyclical recessions.
Unfortunately, for investors it has been more than two decades since we last experienced a cyclical recession. Investors have been conditioned by the last three recessions: the 2001 Tech Wreck/September 11th (structural then event driven), the 2008 Global Financial Crises (structural), and the 2020 COVID Pandemic (event driven). Each of these recessions was severe in length or depth. Investors have forgotten that recessions aren’t always cataclysmic events, sometime they are just a slowdown between economic expansions.
Earning Revisions
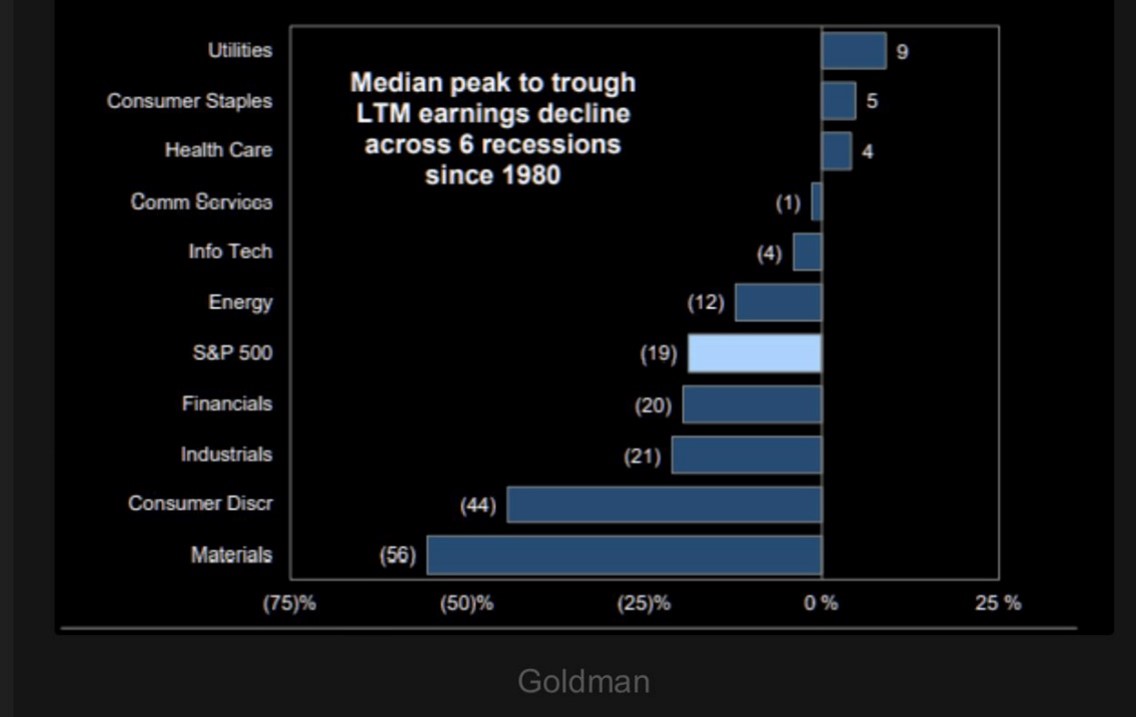
Finally, you may have noticed the plethora of sellside strategists who continue to write that earnings need to fall further to reflect a recession. This is an interesting comment since they are essentially saying that their colleagues in equity research haven’t done their job and revised their estimates lower. It also seems to imply that the market and investors can’t reflect lower earnings estimates, via lower prices until the sellside has revised its estimates lower. Given the free fall in stocks, the earnings revisions typically seen in a recession (for many sectors) may already be priced in.
Median Recessionary Twelve-Month Earning Revisions
What’s an investor to do?
Every market is different and unsettling events can lead to volatile markets that make it difficult to stay invested. The challenge for investors is to remain focused on their long-term objectives. By focusing on the long term, investors can reduce the need for market timing and ‘hero calls’. By saving and investing at a consistent rhythm, across market cycles, an investor will end up buying more securities when the market is inexpensive and fewer securities when the market is expensive.
At the risk of sounding like a broken record, I continue to recommend investors to stay focused on the long term and to pursue a barbell strategy with thoughtful exposure to equity markets, contrasted with cash, actively managed fixed income strategies, and alternative investments to reduce volatility and provide ballast for portfolios.
Let me know if you’d like to have a more involved discussion.
Delli 416-594-8990
delli@cibc.com
Disclaimers:
This information, including any opinion, is based on various sources believed to be reliable, but its accuracy cannot be guaranteed and is subject to change. CIBC and CIBC World Markets Inc., their affiliates, directors, officers, and employees may buy, sell, or hold a position in securities of a company mentioned herein, its affiliates or subsidiaries, and may also perform financial advisory services, investment banking or other services for, or have lending or other credit relationships with the same. CIBC World Markets Inc. and its representatives will receive sales commissions and a spread between the bid and ask prices if you purchase, sell, or hold the securities referred to above. © CIBC World Markets Inc. 2022.
Commissions, trailing commissions, management fees, and expenses may all be associated with hedge fund investments. Hedge funds may be sold by Prospectus to the general public, but more often are sold by Offering Memorandum to those investors who meet certain eligibility or minimum purchase requirements. An Offering Memorandum is not required in some jurisdictions. The Prospectus or Offering Memorandum contains important information about hedge funds - you should obtain a copy and read it before making an investment decision. Hedge funds are not guaranteed. Their value changes frequently, and past performance may not be repeated. Hedge funds are for sophisticated investors only.
If you are currently a CIBC Wood Gundy client, please contact your Investment Advisor.
Related posts
David Ricciardelli
March 28, 2022
Charts to put 2022 in Context
A collection of historical charts trying to add context to events we’ve experienced in 2022.
Read moreDavid Ricciardelli
December 20, 2023
2024
A collection of charts and thoughts aimed at adding context to markets as we turn the page from 2023 to 2024
Read more