David Ricciardelli
March 15, 2024
Money EconomyIs This Market Ahead of Itself?
Since my inboxes are being inundated with articles that include the word ‘froth’ or ‘frothy’ and there has been a notable uptick in clients asking if this market is: ahead of itself, or overvalued, or overheated, I wanted to try to put the current market in context.
Are we in a Stock Market Bubble?
In his recent post, Are we in a Stock Market Bubble? Ray Dalio does an excellent job of comparing the current market to past market bubbles. I’d encourage you to read Ray’s note, but (spoiler alert) Ray’s conclusion is that the current market hasn’t reached the levels of exuberance that are typically associated with market bubbles.
If we are not in a Bubble, is this Market Overheated?
This is a more challenging question. While parts of the market, mainly the stock of companies that are seen as AI beneficiaries, have re-rated higher the broader market doesn’t look overly expensive. According to Bloomberg estimates, the forward price-to-earnings (P/E) ratio for the S&P500 is 18.8x vs a 10-year average of 17.2x. A little more expensive than average but not an alarming level. If we step back and look at the S&P 500 equal weighted index, which is less influenced by the valuations of the Magnificent Seven, the current forward P/E ratio is only 15.3x. This is below its 10-year average of 16.2x. In Canada, after more than two years the S&P TSX Composite is trading near its all-time, but the index is only trading at 13.0x forward P/E vs a 10-year average of 14.4x. For context, the last time the TSX Composite traded near these levels was late 2021 and the index was trading with a forward P/E multiple of 17.0x.
So, the Market is Going Higher?
Markets have a knack for making prognosticators look foolish, so rather than predicting what the market will do in the short term we’ve included some charts that we found interesting.
Jurrien Timmer from Fidelity highlights that after a slow start in 2023, the S&P 500 has now entered the trading range associated with historical bull markets.
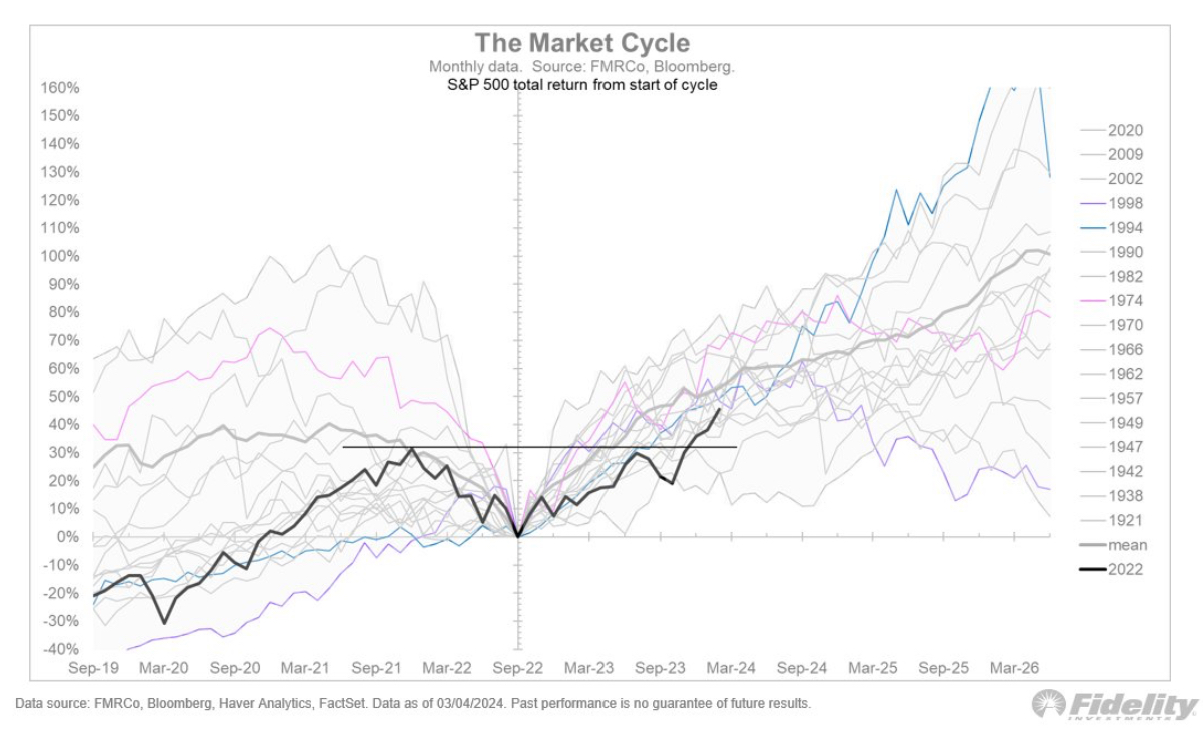
The last year of a Presidential Cycle tends to see most of the gains late in the year.

Bank of America recently highlighted that when the S&P500 is up January, during the fourth year of a Presidential Cycle, the index has finished the year up 100% (11 for 11) of the time with an average return for the year of 16.6%.
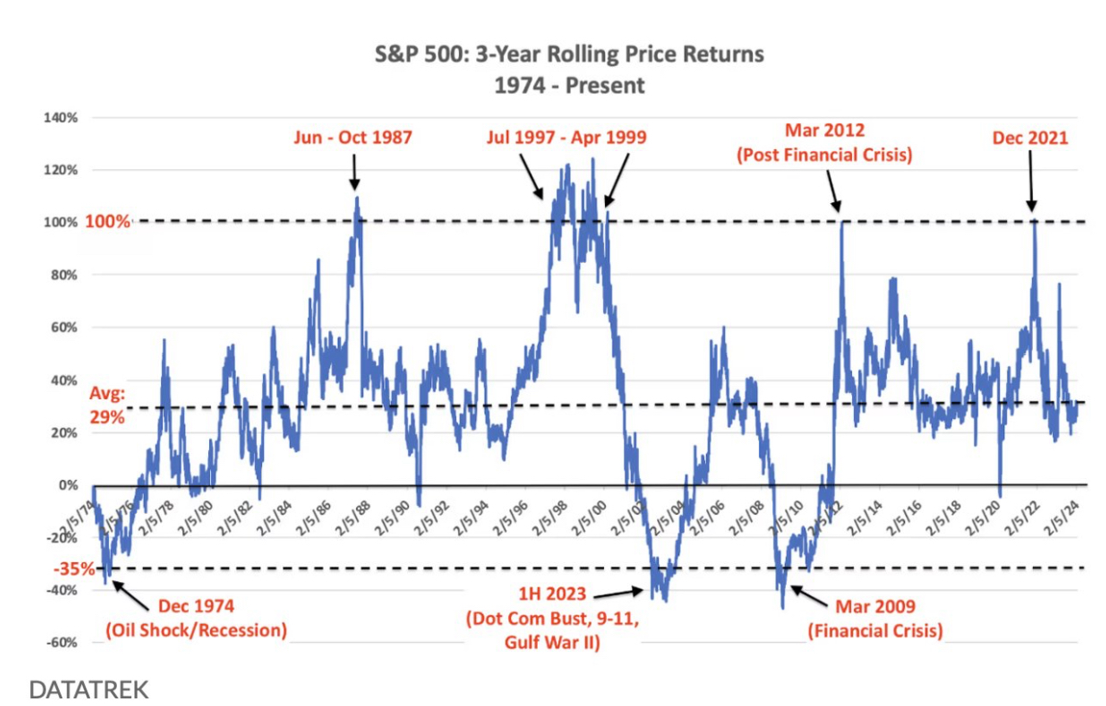
Since 1974, the S&P 500 has advanced at least 100% during the three years prior to peak of the bubble. Over the last three years the S&P 500 is ‘only’ up about 30%.
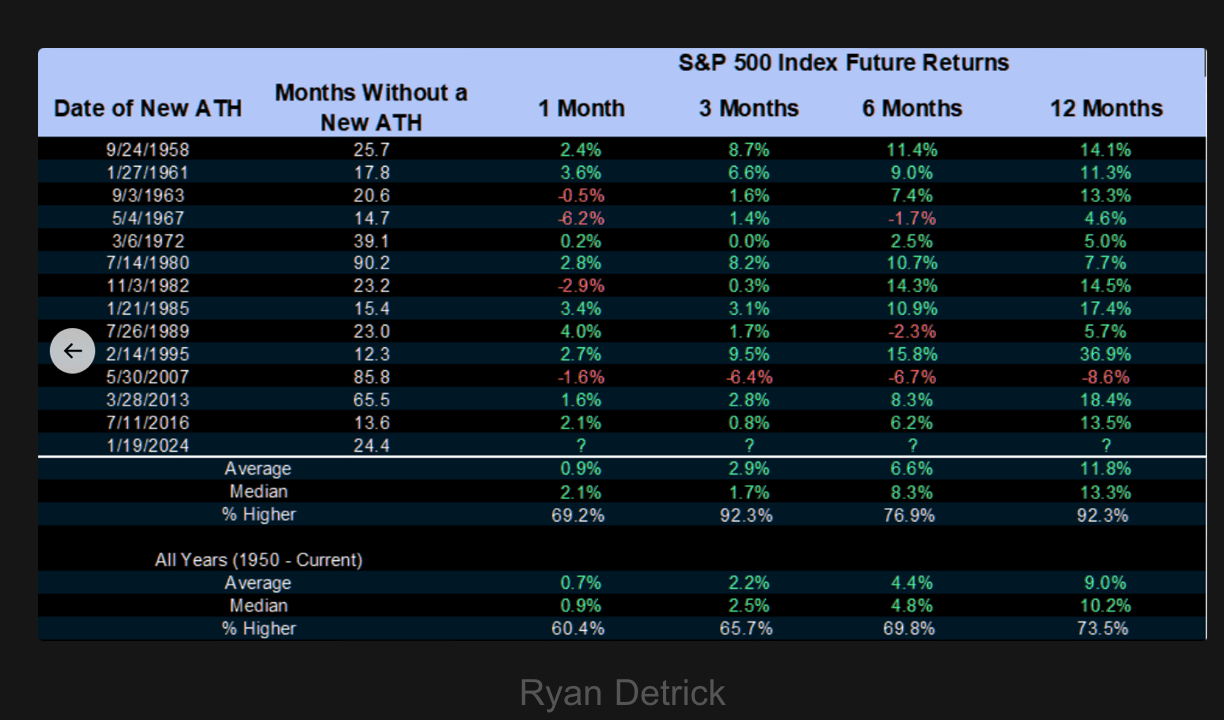
The S&P 500 tends to perform well when it takes more than a year to make a new all-time high. The average return twelve months later is +11.8%.
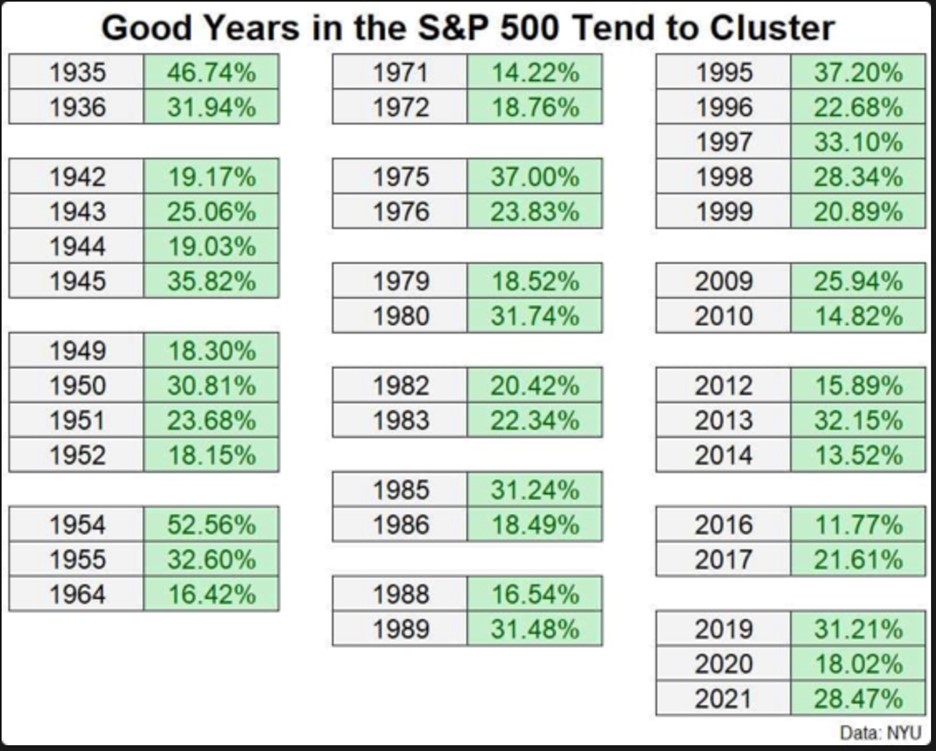
Good years for the S&P 500 tend to cluster together.
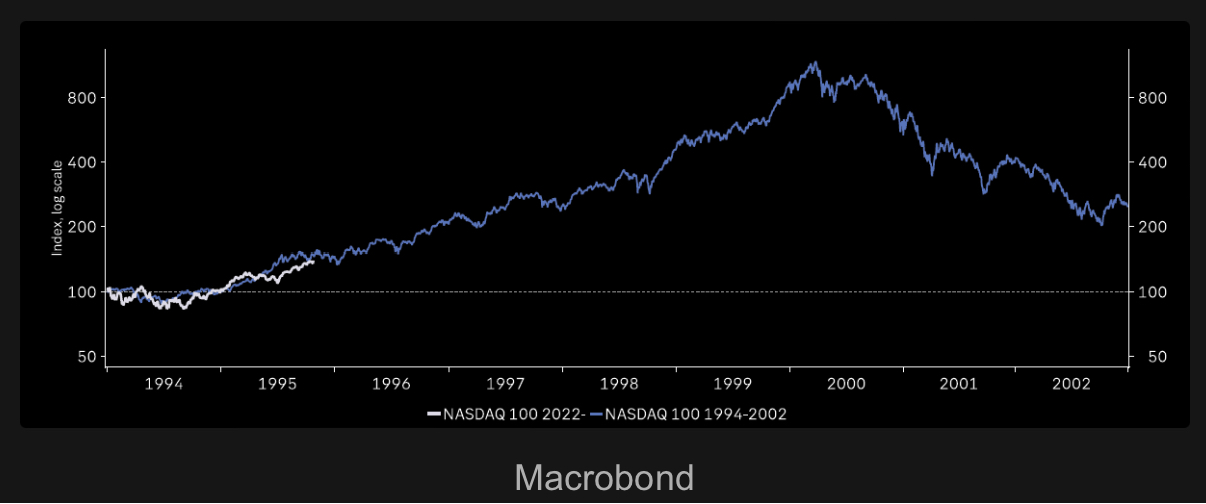
For any bulls looking for reddest meat, please enjoy the chart below which overlays today’s NASDAQ with 1994 when a surge in IT capex and productivity started a multi-year uptrend of the index.
NASDAQ 100 2022 vs 1994
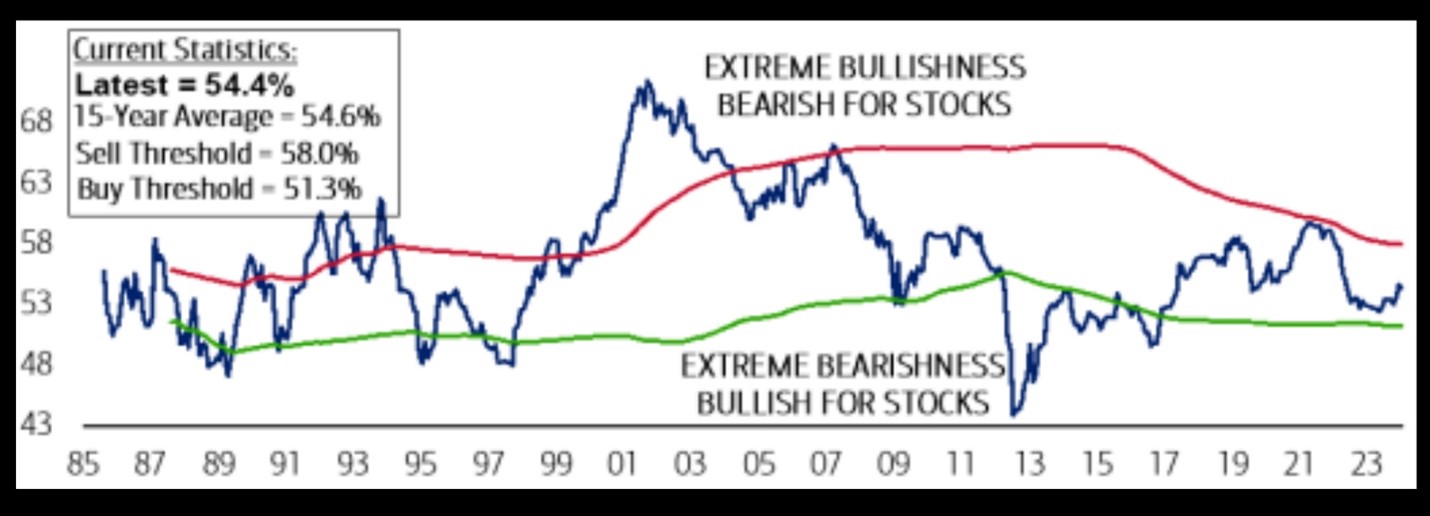
Current sentiment is very middling.
BofA Sell Side Indicator
For the bears we would highlight that in the average year the S&P500 pulls back at least 5% on three occasions.
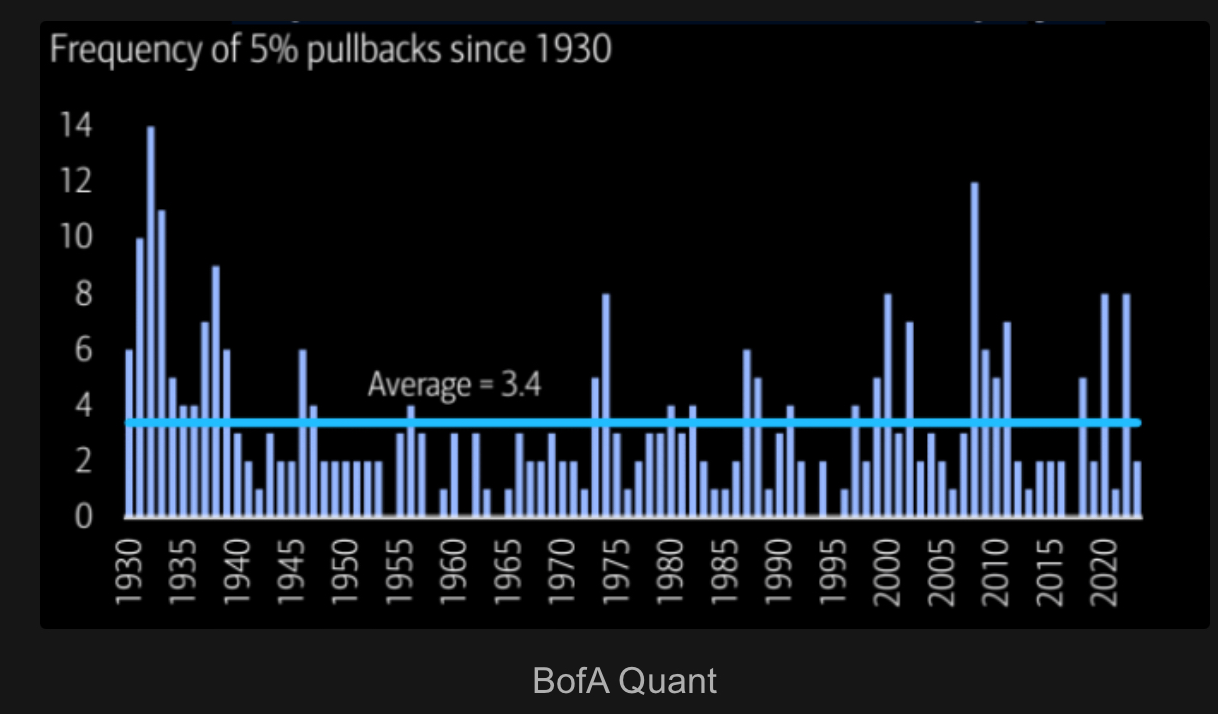
Previously we’ve highlighted that since 1928, the S&P500 has an average intra-year pullback of 16%. The median intra-year pullback for the index in 13%.
Underappreciated Risks
Markets don’t’ like uncertainty and the risk around the US Presidential Election may be underappreciated. In the US Election, both candidates have already been President, and their policies are well known. However, the Presidential candidates share an average age of 79 years. It is conceivable that at least one of these men isn’t on the ballot come November and the market is forced to digest the uncertainty introduced by a new candidate.
What’s an Investor To Do?
A sea of conflicting data points is common in investing. As a result, in our view investors should save and invest consistently across market cycles. With this approach an investor will end up buying more securities when the market is inexpensive and fewer securities when the market is expensive. And most importantly, avoid the need to make ‘hero’ calls on market timing.
We continue to use a barbell strategy where high-quality companies exposed to secular themes are used to provide exposure to equity markets. The other side of the barbell is: cash, actively managed fixed income, and alternative investments that reduce volatility and provide ballast for portfolios. For investors in the distribution phase of their lives, the focus expands to optimize the tax efficiency of distributions.
Please contact me for a more detailed discussion.
Delli (delli@cibc.com)
Disclaimers :
This information, including any opinion, is based on various sources believed to be reliable, but its accuracy cannot be guaranteed and is subject to change. CIBC and CIBC World Markets Inc., their affiliates, directors, officers, and employees may buy, sell, or hold a position in securities of a company mentioned herein, its affiliates or subsidiaries, and may also perform financial advisory services, investment banking or other services for, or have lending or other credit relationships with the same. CIBC World Markets Inc. and its representatives will receive sales commissions and a spread between the bid and ask prices if you purchase, sell, or hold the securities referred to above. © CIBC World Markets Inc. 2024.
Commissions, trailing commissions, management fees, and expenses may all be associated with hedge fund investments. Hedge funds may be sold by Prospectus to the general public, but more often are sold by Offering Memorandum to those investors who meet certain eligibility or minimum purchase requirements. An Offering Memorandum is not required in some jurisdictions. The Prospectus or Offering Memorandum contains important information about hedge funds - you should obtain a copy and read it before making an investment decision. Hedge funds are not guaranteed. Their value changes frequently, and past performance may not be repeated. Hedge funds are for sophisticated investors only.
If you are currently a CIBC Wood Gundy client, please contact your Investment Advisor.


