
David Ricciardelli
July 30, 2024
Financial literacy Economy


Charts for the Lake
Every summer we put together a small collection of charts that we find thought provoking. The intent is to provide some light reading for the dock. As always, your comments and any charts you’d like to share, are more than welcome.
Has the Fed Beaten Inflation (for now)?
The month-over-month change in inflation from May to June was the first disinflation we’ve seen since May 2020 when the COVID had shutdown most of the economy.

The official inflation measures, which are slowed by owners equivalent rent calculations in the US, are starting to catch-up with more nimble inflation measures like Truflation.

The Presidential Cycle
The fourth year of a US Presidential Cycle is generally very good for US stocks (the orange line) … unless we have a lame duck President in the White House (the blue line).

What Volatility?
The dots in the chart below do an excellent job of illustrating how little dispersion we’ve seen in the daily returns of the S&P 500. Since 2022 there has been very little volatility. The S&P 500 was down 2.3% on July 24th, this was the first 2%+ down day in 512 days. For context, that’s the longest streak since 2003.

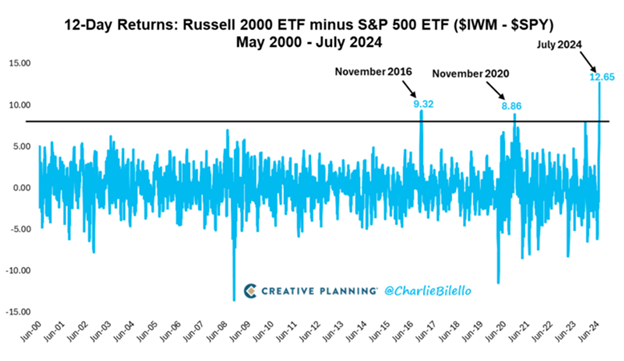
A Very Narrow Market (for now)
Since the bottom in October of 2022, we’ve been commenting on how few companies are outperforming the index. Amazingly the rally has been even narrower in 2024.

Larger capitalization stocks were trouncing smaller capitalization stocks in the S&P 500 through early July.

When small caps caught an incredible bid and raced 10% higher in just 12 trading days. The outperformance of small caps vs large caps was the largest we’ve seen in a 12-day window.
It’s the Same Stocks!
The correlation between the S&P 500 (market cap weighted) and the S&P 500 equal weighted index is now at the lowest level we’ve ever seen.

Retail Investor have a lot of Torque in their Portfolios
Intuitively we’d expect to see equity exposure move higher as equity markets rally. The surprise in 2024 is the amount of beta (or volatility) that retail investors have added to their portfolio. A 1.3 beta implies that retail investors equity portfolio will move up and down 30% more than the S&P 500 index.

Lottery Tickets
In the ‘I had to read it twice’ category, American’s in the poorest 1% of zip codes spend $600 per year of lottery tickets while those in the richest 1% spend only $150 per year. As a percentage of income, the poorest households spend 30 times more of their income than the richest households.

Ending on a Positive Note
Wages have now outpaced inflation on a year-over-year basis for ten consecutive months. Positive for American workers and the US economy.

Enjoy the Lake
Every market is different and volatile markets are unsettling. The challenge for investors is to remain focused on their long-term objectives and to avoid panic selling. If investors can remain focused on their long-term objectives, they can reduce the need for market timing and ‘hero calls’. By saving and investing at a consistent rhythm across market cycles, an investor will end up buying more securities when the market is inexpensive and fewer securities when the market is expensive.
Enjoy your summer and let me know if you’d like to have a more involved discussion.
Delli 416-594-8990
Disclaimers:
This information, including any opinion, is based on various sources believed to be reliable, but its accuracy cannot be guaranteed and is subject to change. CIBC and CIBC World Markets Inc., their affiliates, directors, officers, and employees may buy, sell, or hold a position in securities of a company mentioned herein, its affiliates or subsidiaries, and may also perform financial advisory services, investment banking or other services for, or have lending or other credit relationships with the same. CIBC World Markets Inc. and its representatives will receive sales commissions and a spread between the bid and ask prices if you purchase, sell, or hold the securities referred to above. © CIBC World Markets Inc. 2024.
If you are currently a CIBC Wood Gundy client, please contact your Investment Advisor.
Related posts
David Ricciardelli
September 28, 2020
Investing can be uncomfortable. You rarely make money ‘how’ you want to.
Investors often struggle with the contrast of what they believe should happen, what they think will happen, and how actual events are perceived. Investing in what should happen is more comfortable tha...
Read moreDavid Ricciardelli
October 10, 2023
Tis the Season for Market Rallies?
As the leaves change we try to put investor sentiment, seasonality, equity and fixed income markets, and soft landings into context.
Read more