




Pete White
July 28, 2026



Pete's Ponderings - A 2026 Market Update
The first half of 2026 was dominated by two themes: the geopolitical fallout from the closure of the Strait of Hormuz and the impact of the AI boom across asset classes. To date, investors have largely chosen to look through the conflict in the Middle East as the motivation to avoid material escalation is strong for both sides (for Iran, the threat is existential, while the other is political given how unpopular the conflict has proven to be in the U.S.). Whether this is the right or wrong view is academic in the short term as record corporate earnings and strong economic data are taking the front seat against the risk that materially higher oil prices lead to another jump in inflation, and, in turn, global borrowing costs. The rate hikes of 2022, and resulting stock market correction, are fresh on many investors' minds.
Meanwhile, AI investment continues to grow exponentially, with positive impacts across the global economy – as increased productivity makes its way to higher margins and a more robust bottom line. As importantly, the thousands employed to build out the infrastructure needed to support the agent swarms and vibe coding has been a boon to the global economy. The scale and speed of the AI buildout is truly staggering when put into a historical context. The ~$1T dwarfs previous megaprojects, even on an inflation-adjusted basis: 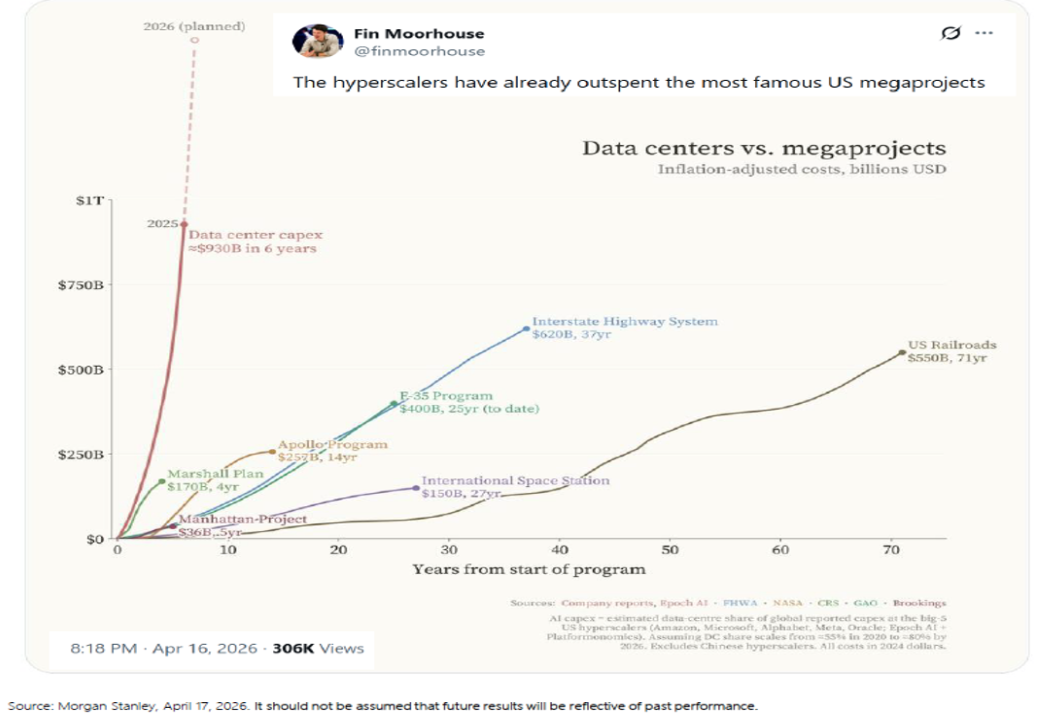
The good news for investors is that the trillions of dollars of capital expenditures, and the productivity gains from AI usage have already flattered corporate earnings, which are expected to grow materially in 2026, particularly in regions with substantial AI investment (eg. The Emerging Markets).
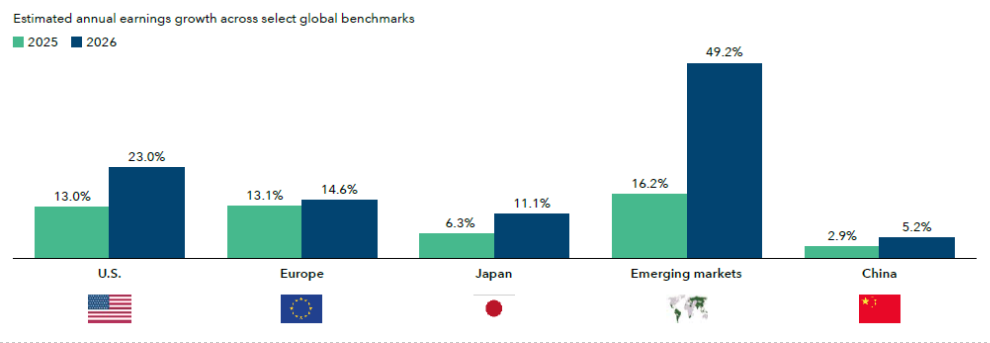
(source: Capital Group Mid-Year Review)
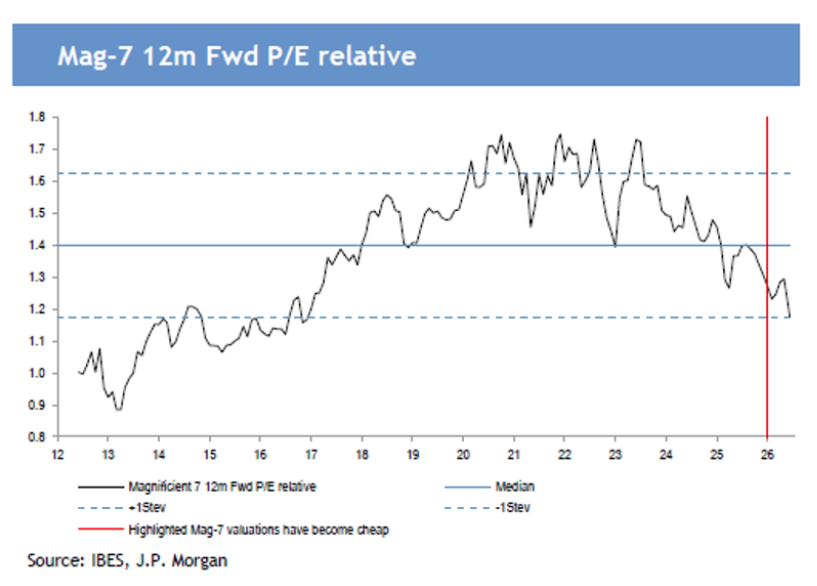
Earnings growth drive more sustainable long-term returns, which can be hyper charged when investors pay low multiples for every dollar of earnings. The current market is anything but cheap, but pockets of value exist. While the broader market is trading at a multiple of earnings last seen during the tech boom and bust of the late 1990s, some of the market leaders (e.g. “the Magnificent 7” of Apple, Microsoft, Google, Amazon, Nvidia, Meta and Tesla) are the cheapest they’ve been in almost a decade.
Shiller Cyclically Adjusted PE Multiple for U.S. Stocks
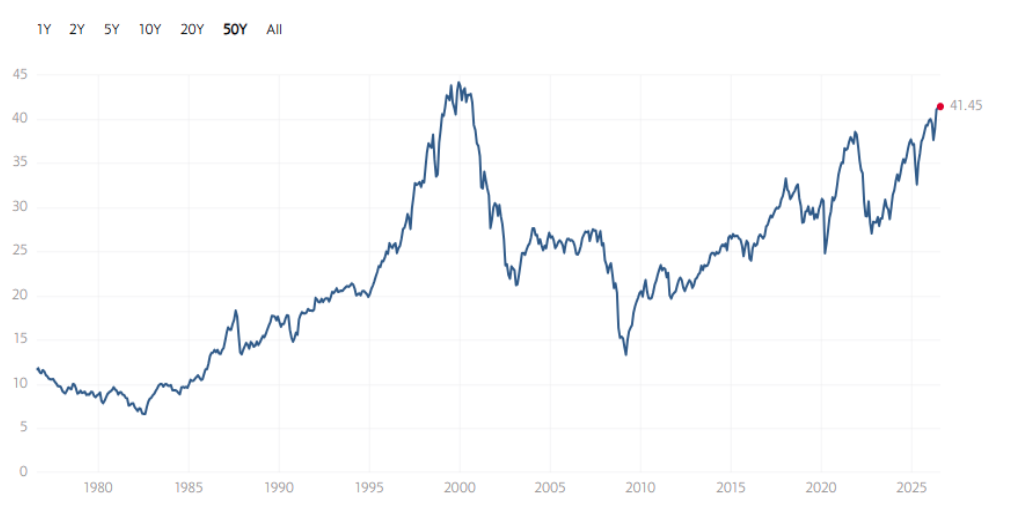
https://www.multpl.com/shiller-pe
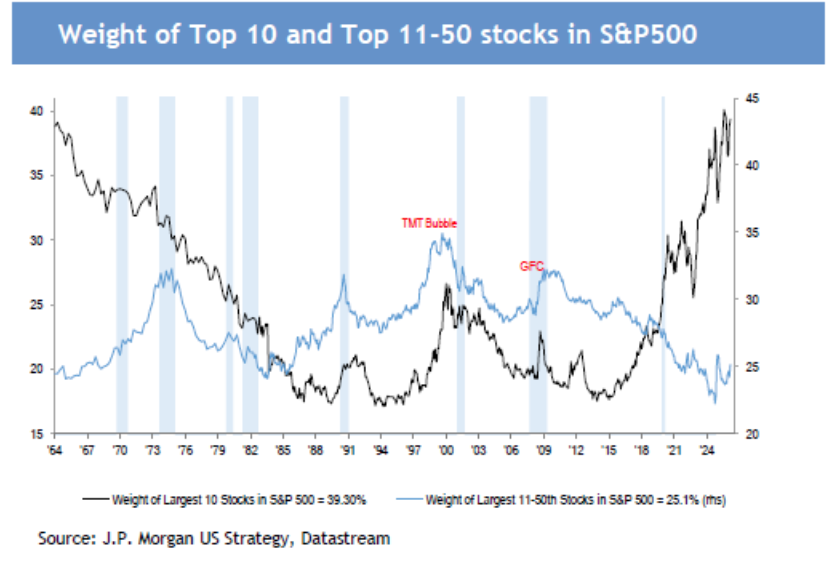
One of our biggest concerns is concentration. A market that lacks breadth is not a healthy market, particularly if it’s concentrated in one sector or one theme (e.g. AI related trades).
The AI trade has become a global phenomenon, as chip manufacturers like SK Hynix, Samsung, and Taiwan Semi, and global tech names like Tencent and Alibaba have come to dominate the Emerging Markets as well.
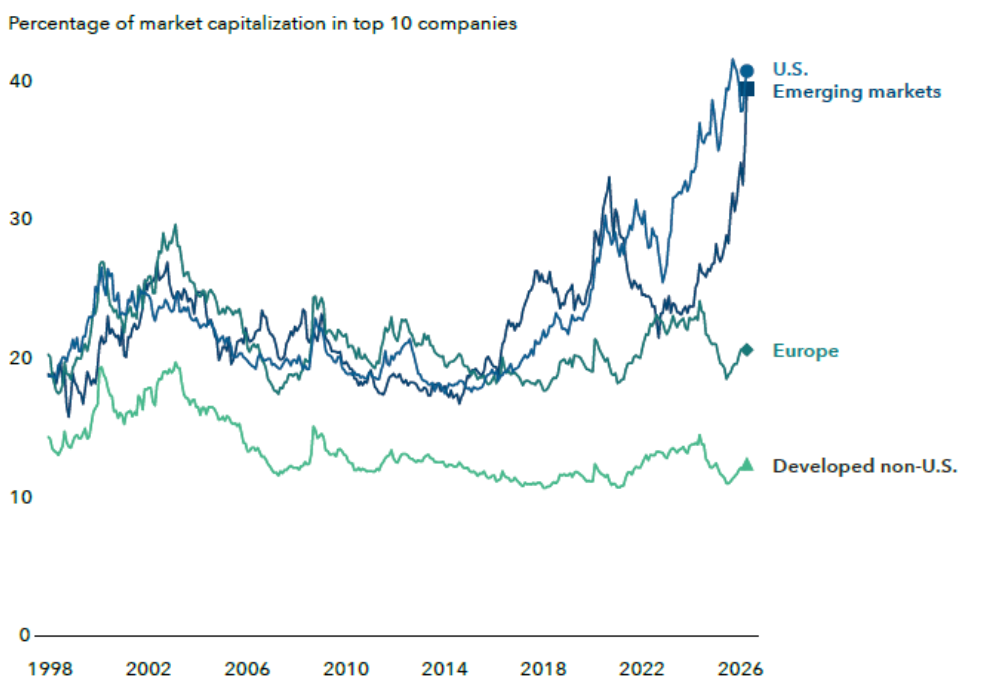
(Source: Capital Group Mid-Year Outlook)
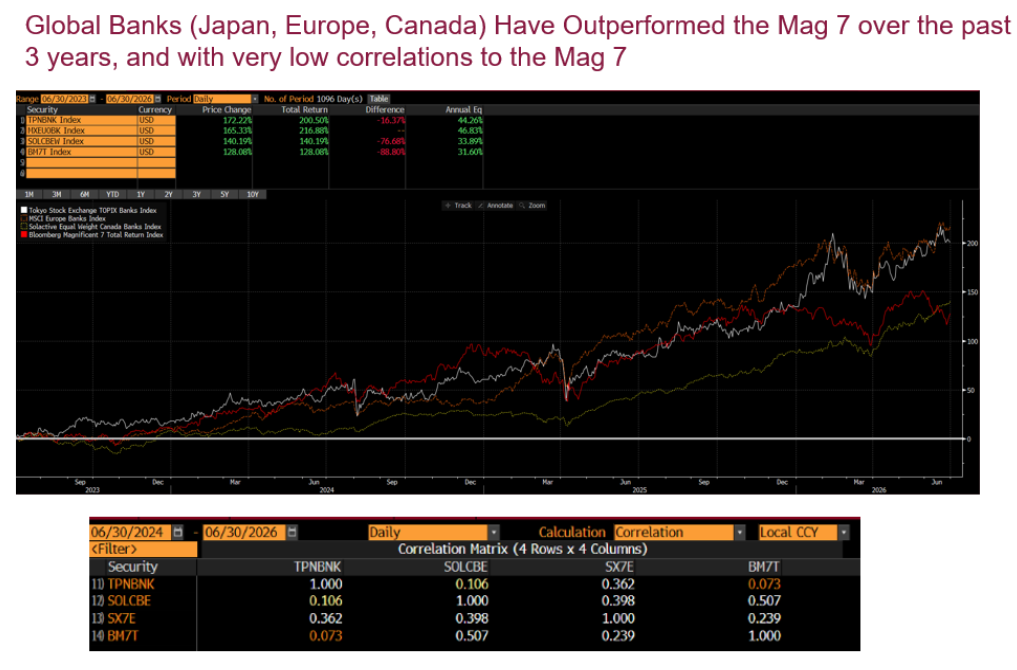
So where does one find diversification? While no longer cheap, global financials (including Canadian Banks) have shown low correlations to big tech while providing comparable performance since 2022.
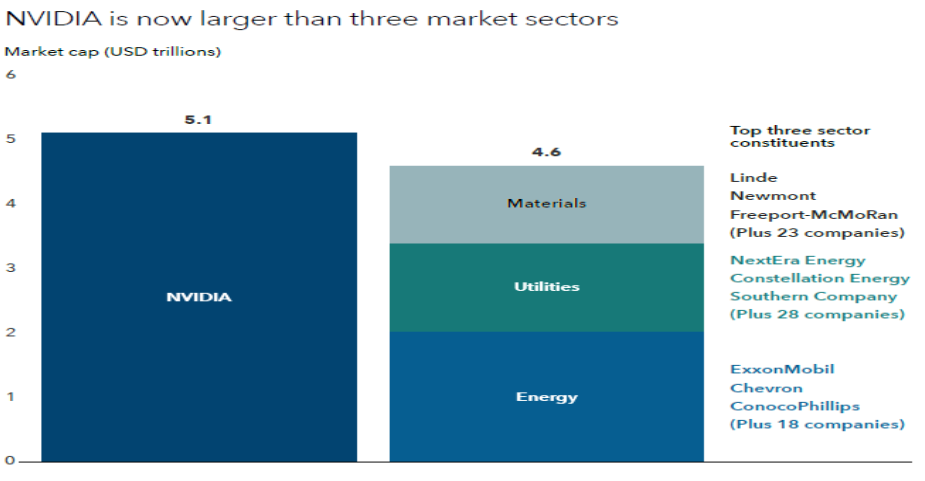
There is also good value in Healthcare and Real Assets like utilities, materials, and energy. The combined value of the 78 companies in these sectors is currently less than Nvidia on its own.
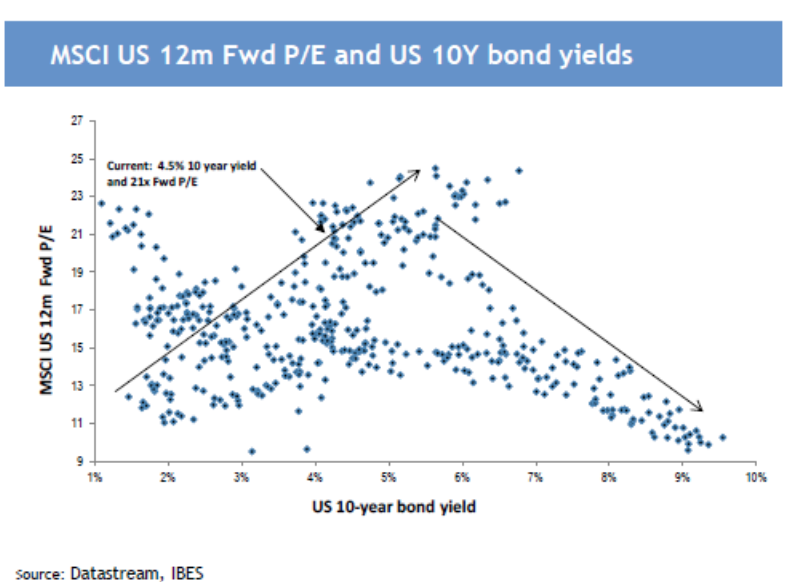
What keeps us up at night? We always keep an eye on 10-year bond yields. Long term bull markets are built on rising valuations, and the opposite holds true for long-term market declines. Interest rates drive long-term valuations. Right now, they are at a “goldilocks” spot where they aren’t too high (reflecting high inflation) and aren’t too low (reflecting low growth). When they peak above 6%, that’s where valuations compress.
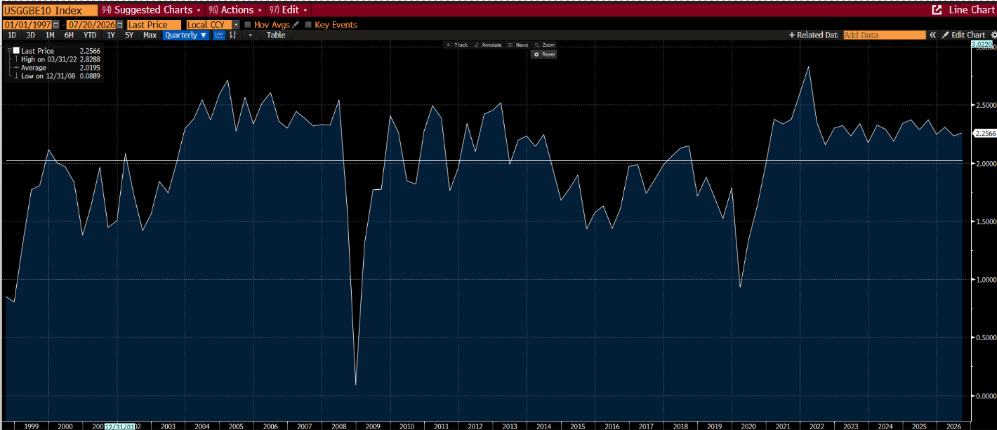
What could cause long-term rates to spike? Sustained inflation. While inflation is a near-term concern, long-term inflation expectations remain firmly rooted around the 2.25% range (as measured by the breakeven rate between US inflation protected securities and US treasury bond yields of the same maturity).
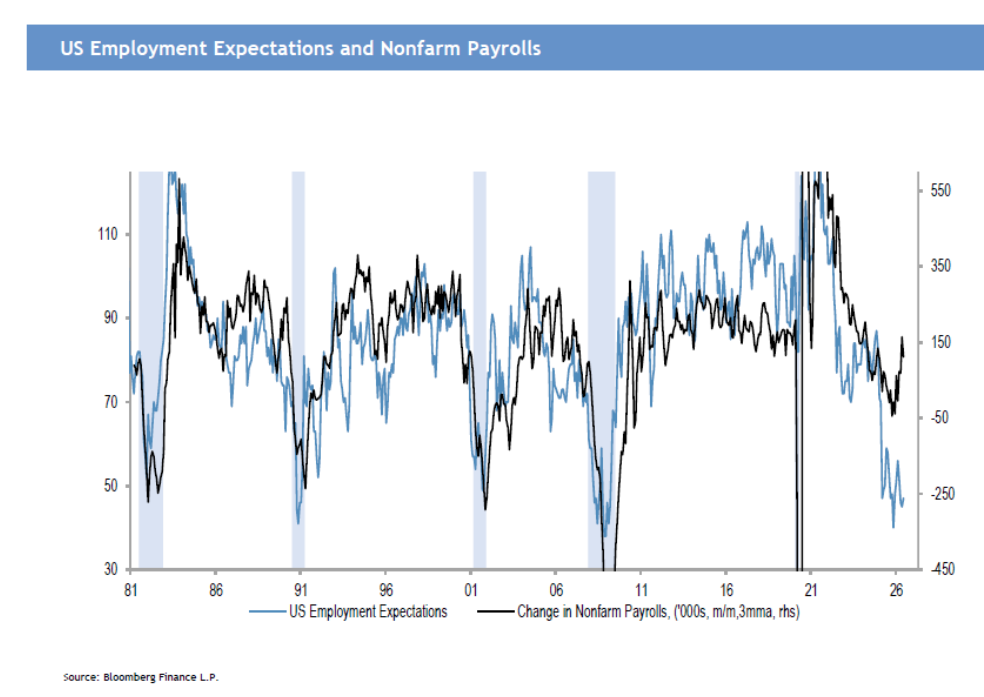
The biggest driver of persistent inflation tends to be wage inflation. The bargaining power of labour is simply not present. Concerns that AI may be less of a complementary technology and more of a replacement technology erodes labour’s pricing power further.
The Bottom Line
While valuations are high, there is earnings growth to support them, and a wall of capital expenditures to support further growth. Geopolitics is the wild card in this equation. ~25% of the world’s seaborne oil and 20% of global liquefied natural gas travel through the Strait of Hormuz. Higher oil begets higher inflation, which in turn begets higher interest rates. The threat of permanent closure of the Strait is a real and present danger for the global economy. And with CUSMA back on the negotiating table and mid-term elections upcoming, there is more than enough to raise our pulses now that the World Cup is over. Let’s hope that cooler heads prevail in the months ahead. Meanwhile, the equity risk premium (the excess compensation one receives for the excess volatility of investing in stocks) is earning its name.