


Value Shopping
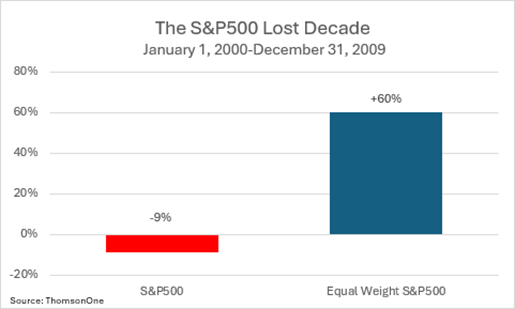
Between January 1, 2000, and December 31, 2009, the US S&P 500 Index experienced a significant market correction at the start of the period and a long road to recovery that added up to a ‘lost decade’ of returns. The S&P 500 index is market capitalization weighted – each company’s percentage weight in the index is determined by the company’s size/market value. The S&P500 delivered a negative total return of approximately -9% over those ten years. There’s also an Equal Weighted S&P500 where each of the 500 components represents 0.2% of the index. This version of the index produced a positive return of over +60%.
The primary reason for this performance gap lies in the weighting methodologies. The standard S&P 500 is market-cap weighted, meaning large-cap companies (notably technology giants like Microsoft, Cisco, and later, Apple) carry much greater influence. At the start of the 2000s, many of these large-cap names were overvalued due to the dot-com bubble. When the bubble burst in 2000–2002, these stocks fell sharply, dragging down the entire index -50%.
In contrast, the S&P 500 Equal Weight Index gives each stock the same weight, regardless of size. This approach emphasizes mid- and small-cap stocks more than the market-cap weighted index does. During the 2000s, many of these smaller companies outperformed the large-cap stocks, particularly during the tech crash and during the commodities-driven rally of the mid-2000s.
Additionally, and not to be forgotten, the equal weight index benefits more from rebalancing. When stocks underperform and their prices drop, equal weighting buys more of them, and trims exposure to outperformers, effectively implementing a contrarian strategy that results in ‘buying low and selling high’. This rebalancing effect led to stronger long-term returns during a volatile and range-bound market cap weighted index in the 2000s, where mean reversion benefited the equal weight strategy.
In early 2000 Microsoft was the largest S&P500 index component, valued at a $500+ billion and trading at nearly 70x earnings. This is a huge premium to the market’s long term average of 16x. After a tough 2000 and early 2001, Microsoft shares were down -80% and trading at an attractive 8x earnings. It spent the rest of the decade clawing its way back up, not breaking even for 13 years. Cisco Systems Inc took 21 years to recover to its 2000 high and chipmaker Intel took 18 years. A reminder that great companies aren’t necessarily great stocks to own. Overpaying for any asset often leads to a weak long rate of return. These stories drove the lost decade and should be a reminder that entry price dictates future returns.
As we have shared over the past year we have actively been selling off the S&P500 market cap weighted exposure, shifting focus to the equal weighted version of the index while also being laser focused on finding individual companies offering value opportunities, both around the world and here at home.
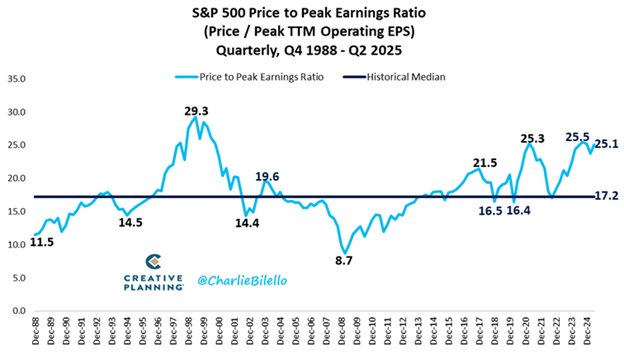
The reason is valuation – the mega capitalization tech companies like Microsoft, Apple and Amazon are again trading at eye-watering valuations – 100% to 200% above the historical market multiple. This isn’t limited to tech as household names like Home Depot and Walmart also trading at 100% premiums. Costco trades at 55x earnings as of this writing, a 250% price premium.
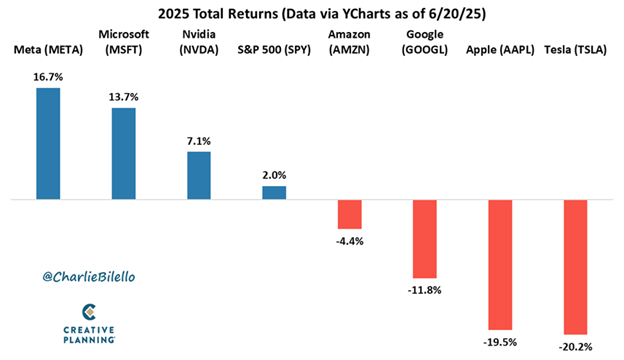
The not so magnificent seven have been disappointing performers thus far in 2025. Their size and weight in the S&P500 means they’re largely determining the index price direction. If momentum is against them, this could be a tough couple of years for the index.
Our focus on value and quality will be a theme for the next several years, one we’re happy to follow as it has rewarded our clients handsomely over the 50+ years our advisory group has been helping our clients.
Brady Clark Advisory Group