


Fear of Success
We are hearing a lot of concern from clients about the markets – not because things are bad, but because they’ve been doing so well over the past three years. It is almost as if investors are feeling guilty that we haven’t seen a bear market since 2022. This is somewhat natural as we have seen 26 bear markets in the last 100 years, a rate of one roughly every four years. Of course it’s not consistently that way - we saw three distinct bear markets from 2018 to 2022 and have also seen bull markets that last over a decade. The chart below illustrates the relative magnitude of bull markets vs bear markets. Mathematically at least, the chart shows that the pain of the bears is far outweighed by the reward of owning the bulls.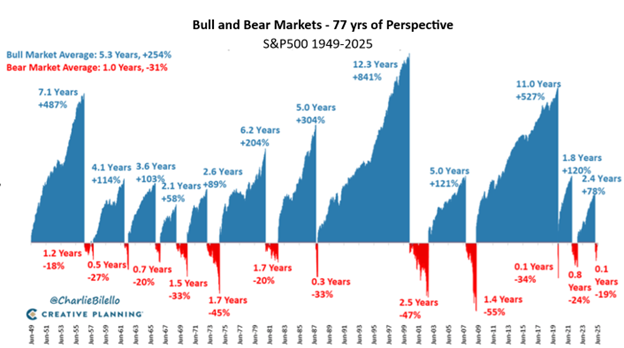
Even seasoned investors are expressing concern, fearing we are due. Perhaps the negative news cycle and the US political drama is making it feel like things are worse than they are. We think it’s interesting because when bear markets hit, many investors seem caught off guard as if they’ve never been through one before. They often feel compelled to take selling action – this is a natural human response. Of course this isn’t the Brady Clark Advisory Group’s philosophy – we fill our portfolios with quality and value so that if (and when!) we encounter negative markets, we are armed with confidence and can stay the course. We follow our tested and disciplined process of rebalancing that often sees us trimming stocks near market peaks and adding near market bottoms at a time when many investors are panic-selling.
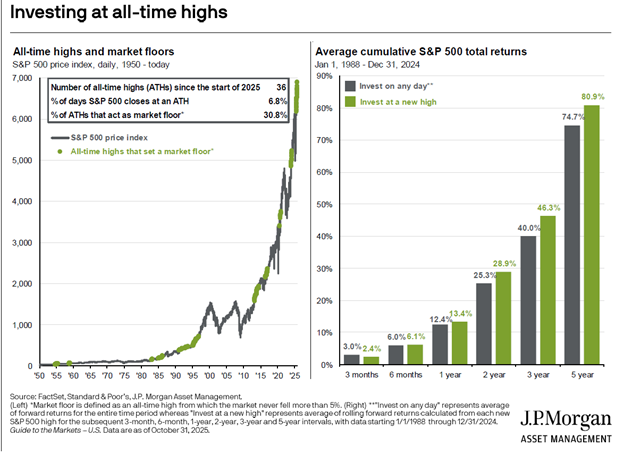
The S&P 500, which tracks the performance of 500 of the largest publicly traded U.S. companies and represents about 70% of the global stock market, spends a surprising amount of time at or near all-time highs. Because it represents a broad and dynamic slice of the U.S. economy, the index tends to rise over time as businesses grow, earnings increase, and inflation lifts nominal values. Historical data shows that the S&P 500 reaches new all-time highs quite frequently - often several times within a single year during bull markets. Nearly 7% of the historical daily market closes were at all time highs. This isn’t something new to be feared.
There’s a thought process that if you bought at an all-time high you in theory have paid a high price that could lead to poor returns. Not necessarily. The chart below on the right shows that comparing the short, medium and long term returns of investors who bought on peak days vs those who bought on all other days actually favours the peak buyer in every time period but 3 months. This was surprising data to us too, but it illustrates the concept that all time highs tend to be hit in periods that are about to produce more all time highs. Of course the best result would be buying at the bottom of bear markets however nobody has yet rung a bell to let us know when the bottom is so we can’t rely on that approach.
With 7% of the days being at all-time highs that means 93% of the days are below the highs. Interestingly half of those are still within 5% of the all-time high so again, being around the ‘top’ of the market is normal. Calling it a top implies there’s a permanent ceiling – we have to remember that is not the case. The trend line around which stock prices oscillate is not flat, it is an ongoing upward sloping line. If we do see declines and they get significant enough to reach bear market territory (-20% or more), we should remember that over the last 100 yrs, the average recovery period from the bottom of a bear to a new all-time high been 17 months. Not fun, but nothing that should derail an equity investor who should have at least a 5 yr time horizon when owning stocks.
This data highlights an important feature of equity markets: they are designed to grow over the long run. While short-term volatility can be unsettling, the market’s consistent tendency to push toward new highs reflects the overall resilience of the economy and corporate profits. For long-term investors, this historical behavior reinforces the value of staying invested through market cycles rather than attempting to time short-term fluctuations.